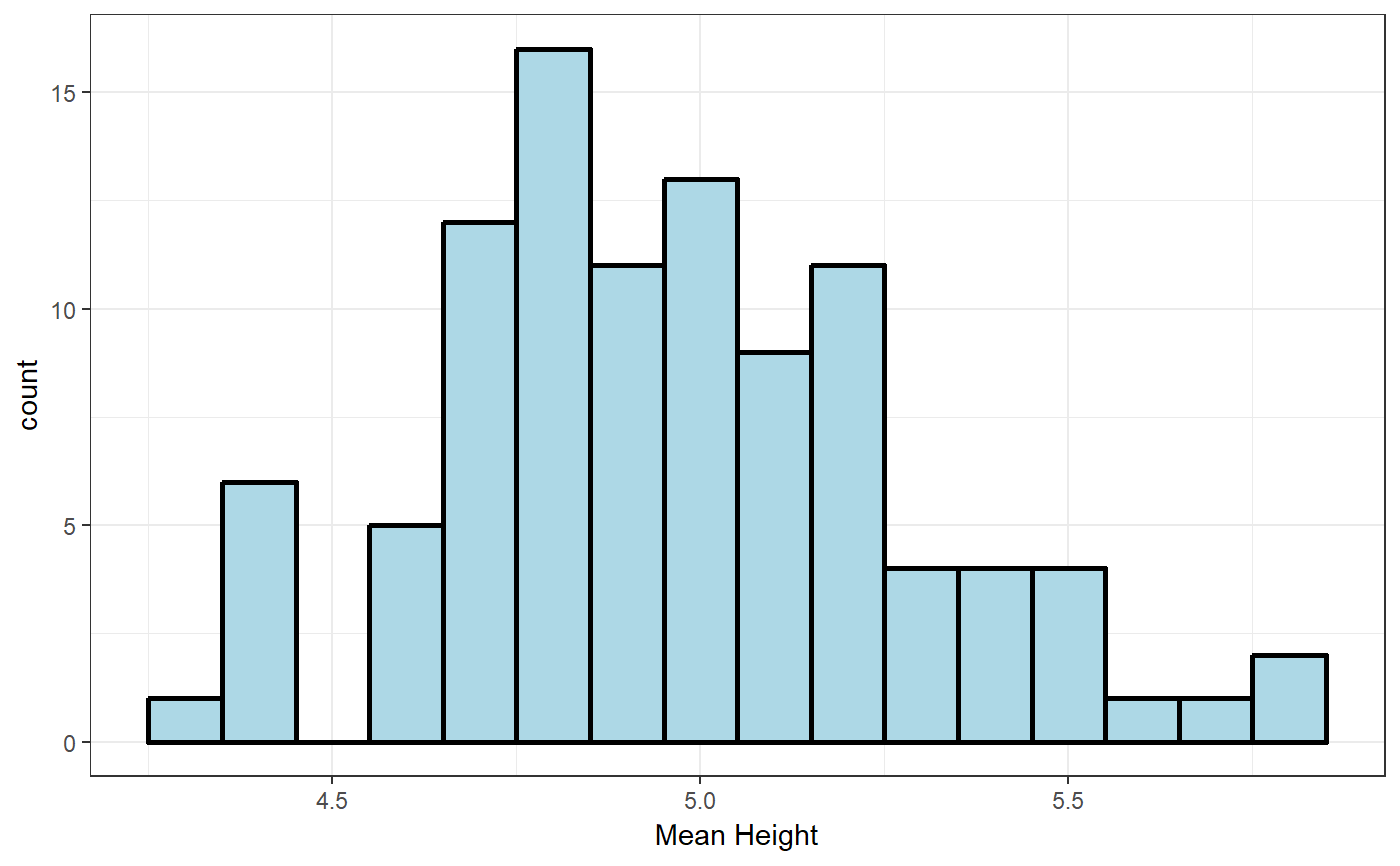
Returns a ggplot or plotly object of a histogram generated from a set of sample means
sampleMeans_histogram(sampleMeans, binwidth = 1,
  variableName = "Height", plotly = FALSE)
Arguments
| sampleMeans | data frame of sample means |
|---|---|
| binwidth | width of bins in histogram |
| variableName | name of variable to be labeled on the x-axis of histogram |
| plotly | specifies whether a plotly object is desired |
Value
A ggplot or plotly object, depending on whether the plotly argument was specified TRUE or FALSE.