Plot a list of x3ps
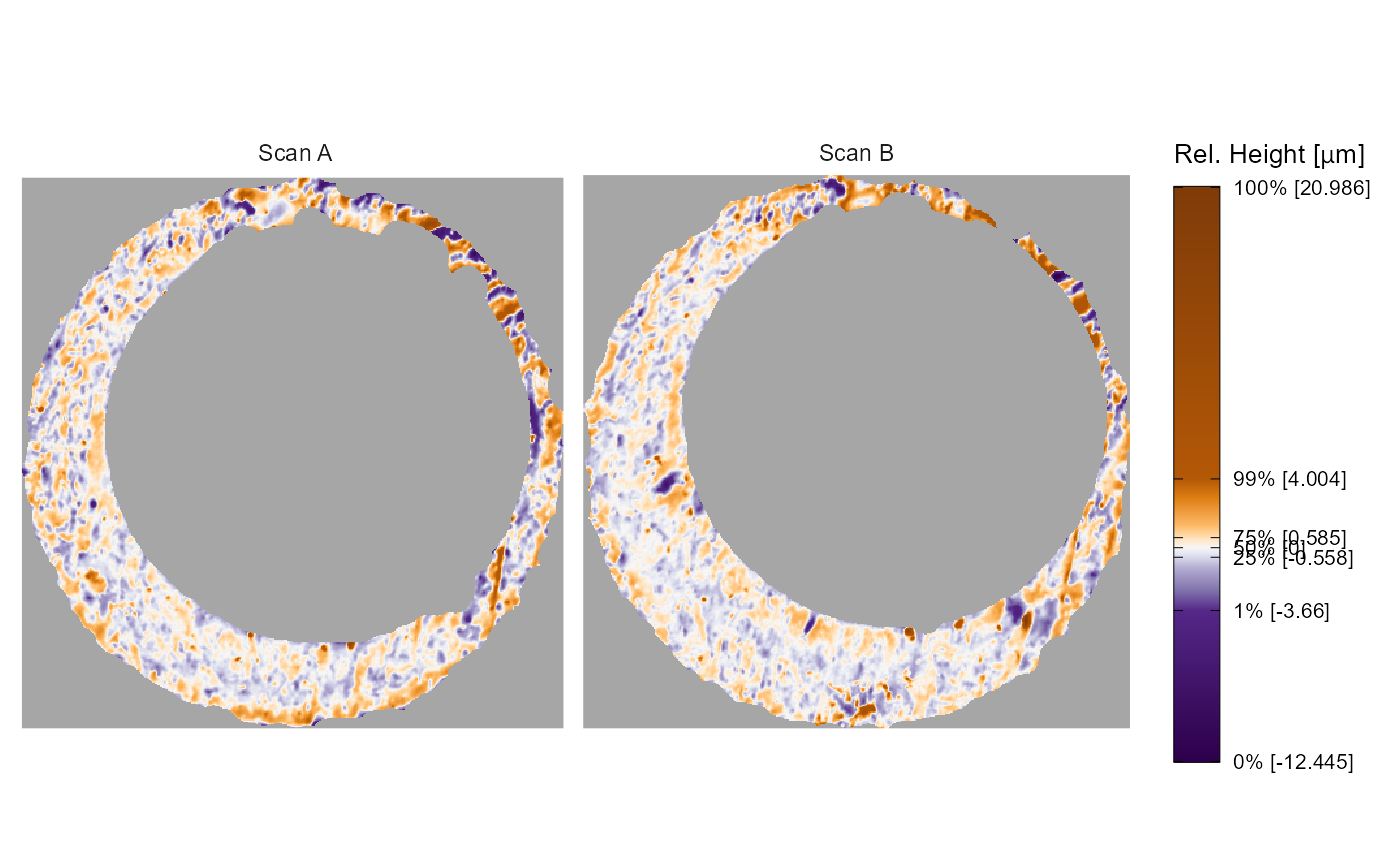
x3pPlot.RdPlots the surface matrices in a list of x3p objects. Either creates one plot faceted by surface matrix or creates individual plots per surface matrix and returns them in a list.
Usage
x3pPlot(
  ...,
  x3p.names = NULL,
  output = "faceted",
  height.colors = c("#2d004b", "#542788", "#8073ac", "#b2abd2", "#d8daeb", "#f7f7f7",
    "#fee0b6", "#fdb863", "#e08214", "#b35806", "#7f3b08"),
  height.quantiles = c(0, 0.01, 0.025, 0.1, 0.25, 0.5, 0.75, 0.9, 0.975, 0.99, 1),
  legend.quantiles = c(0, 0.01, 0.25, 0.5, 0.75, 0.99, 1),
  na.value = "gray65",
  legend.length = grid::unit(3, "in")
)

x3p_plot(
  ...,
  x3p.names = NULL,
  output = "faceted",
  height.colors = c("#2d004b", "#542788", "#8073ac", "#b2abd2", "#d8daeb", "#f7f7f7",
    "#fee0b6", "#fdb863", "#e08214", "#b35806", "#7f3b08"),
  height.quantiles = c(0, 0.01, 0.025, 0.1, 0.25, 0.5, 0.75, 0.9, 0.975, 0.99, 1),
  legend.quantiles = c(0, 0.01, 0.25, 0.5, 0.75, 0.99, 1),
  na.value = "gray65",
  legend.length = grid::unit(3, "in")
)
Arguments
- ...
one or more x3p objects
- x3p.names
character vector containing names of each x3p object
- output
dictates whether one plot faceted by surface matrix or a list of plots per surface matrix is returned. The faceted plot will have a consistent height scale across all surface matrices.
- height.colors
vector of colors to be passed to scale_fill_gradientn that dictates the height value colorscale
- height.quantiles
vector of quantiles associated with each color defined in the height.colors argument
- legend.quantiles
vector of quantiles to be shown as tick marks on legend plot
- na.value
color to be used for NA values (passed to scale_fill_gradientn)
- legend.length
length of the plot legend. Passed to the barheight argument of the ggplot2::guide_colorbar function