Visual Diagnostics for Algorithmic Cartridge Case Comparisons
Current Practice
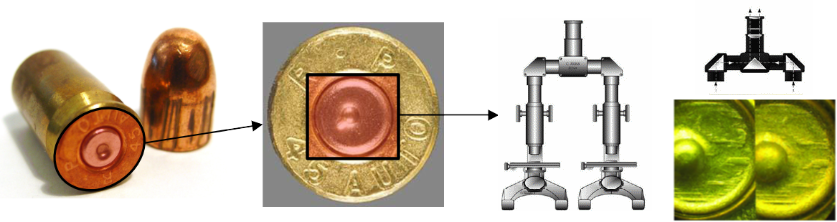
Cartridge case recovered from crime scene vs. fired from suspect’s firearm
Place evidence under a comparison microscope for simultaneous viewing (Thompson 2017)
Assess the “agreement” of impressions on the two cartridge cases (AFTE Criteria for Identification Committee 1992)
Step 2: Compare Full Scans
- Registration: Determine rotation and translation to align two scans
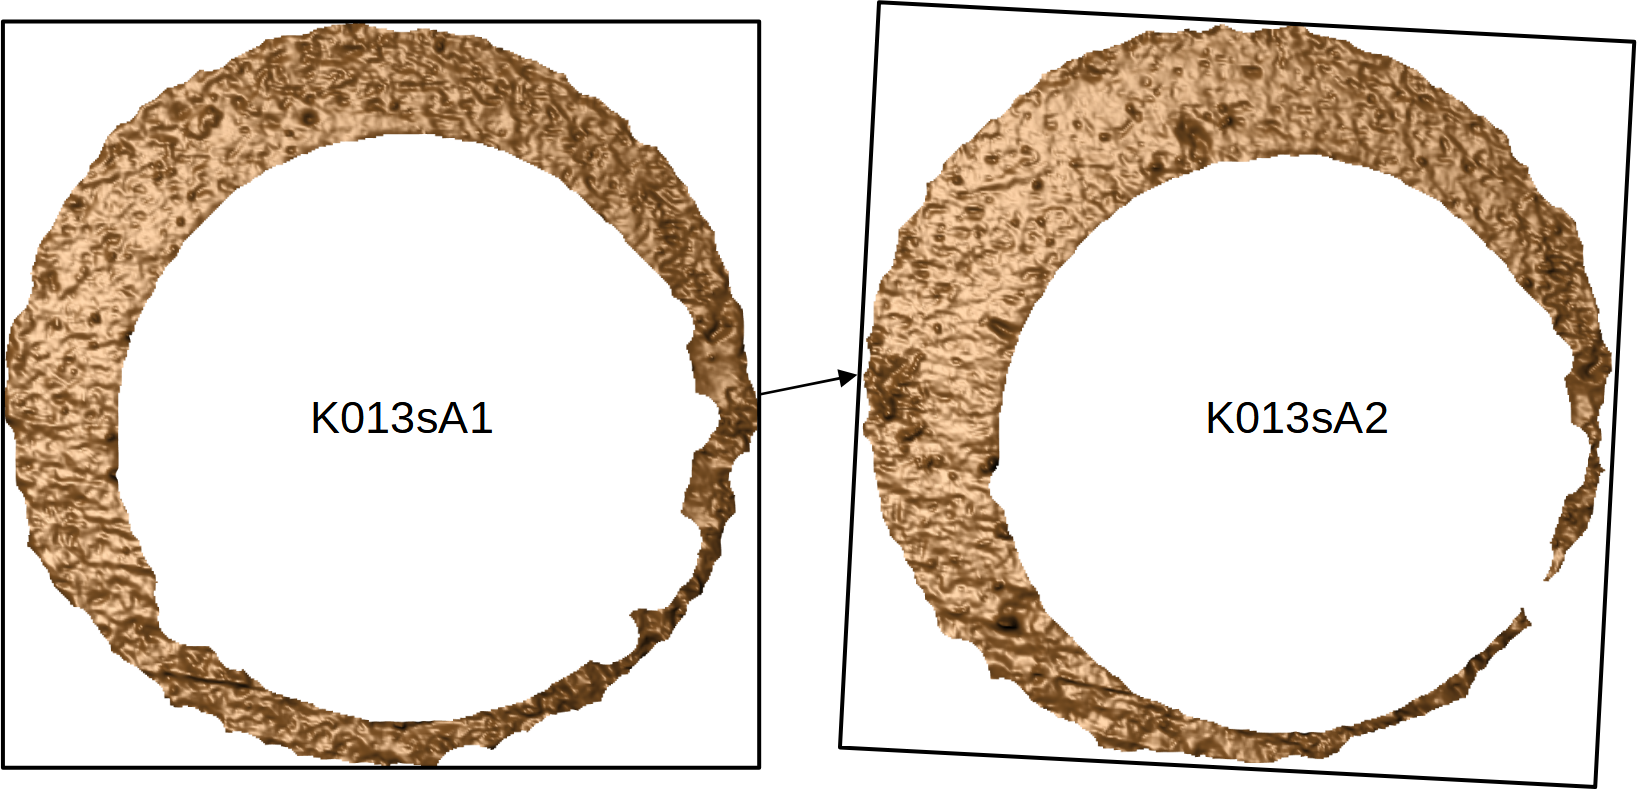
Cross-correlation function (CCF) measures similarity between scans
- Choose the rotation/translation that maximizes the CCF
Step 2: Compare Cells
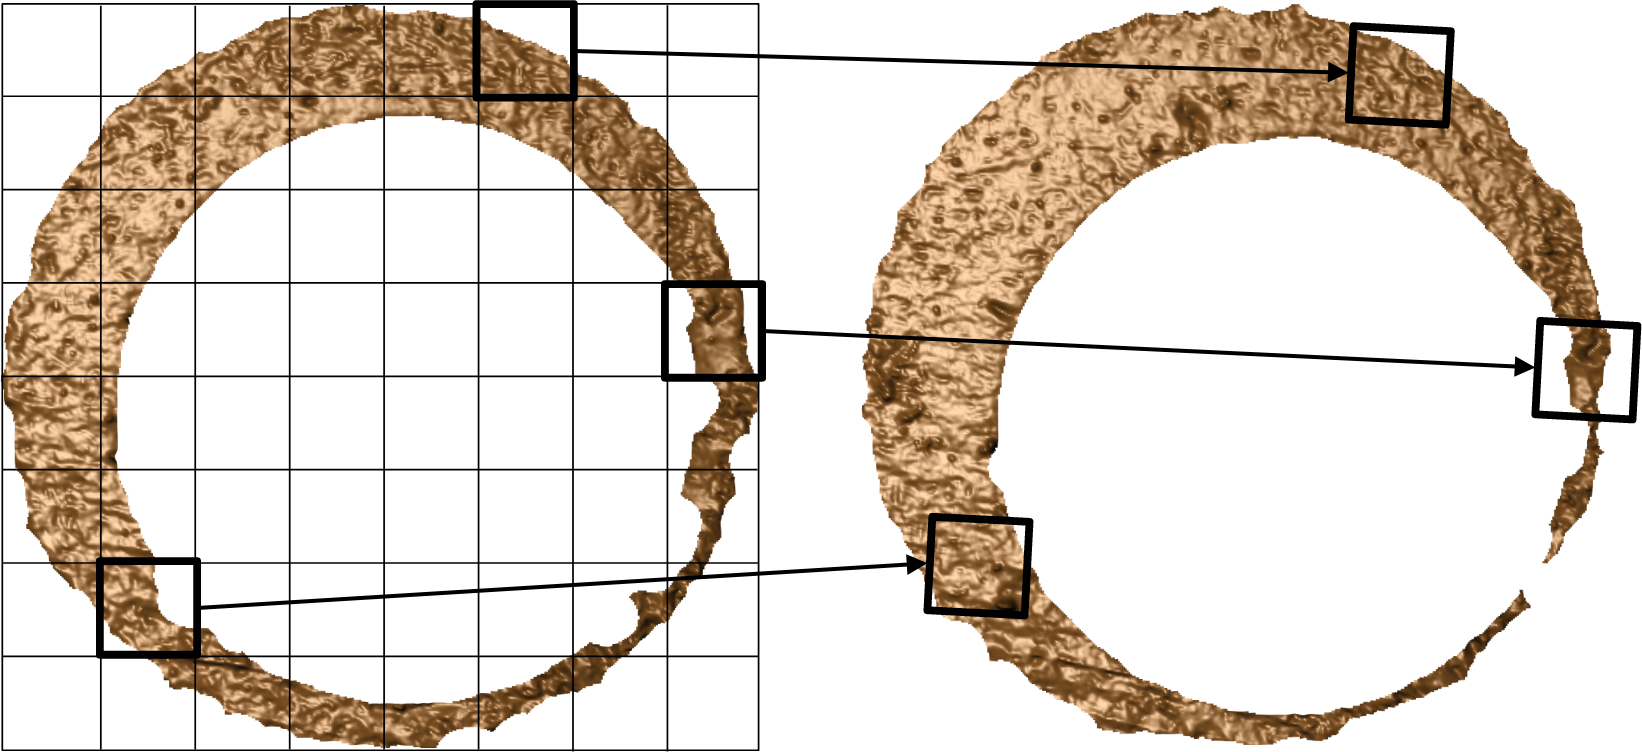
Split one scan into a grid of cells that are each registered to the other scan (Song 2013)
For a matching pair, we assume that cells will agree on the same rotation & translation
Why does the algorithm “choose” a particular registration?
Step 3: Score
Measure of similarity for two cartridge cases
Maximized CCF (0.27 in example below) (Vorburger et al. 2007; Tai and Eddy 2018)
Congruent Matching Cells (11 CMCs in example below) (Song 2013)
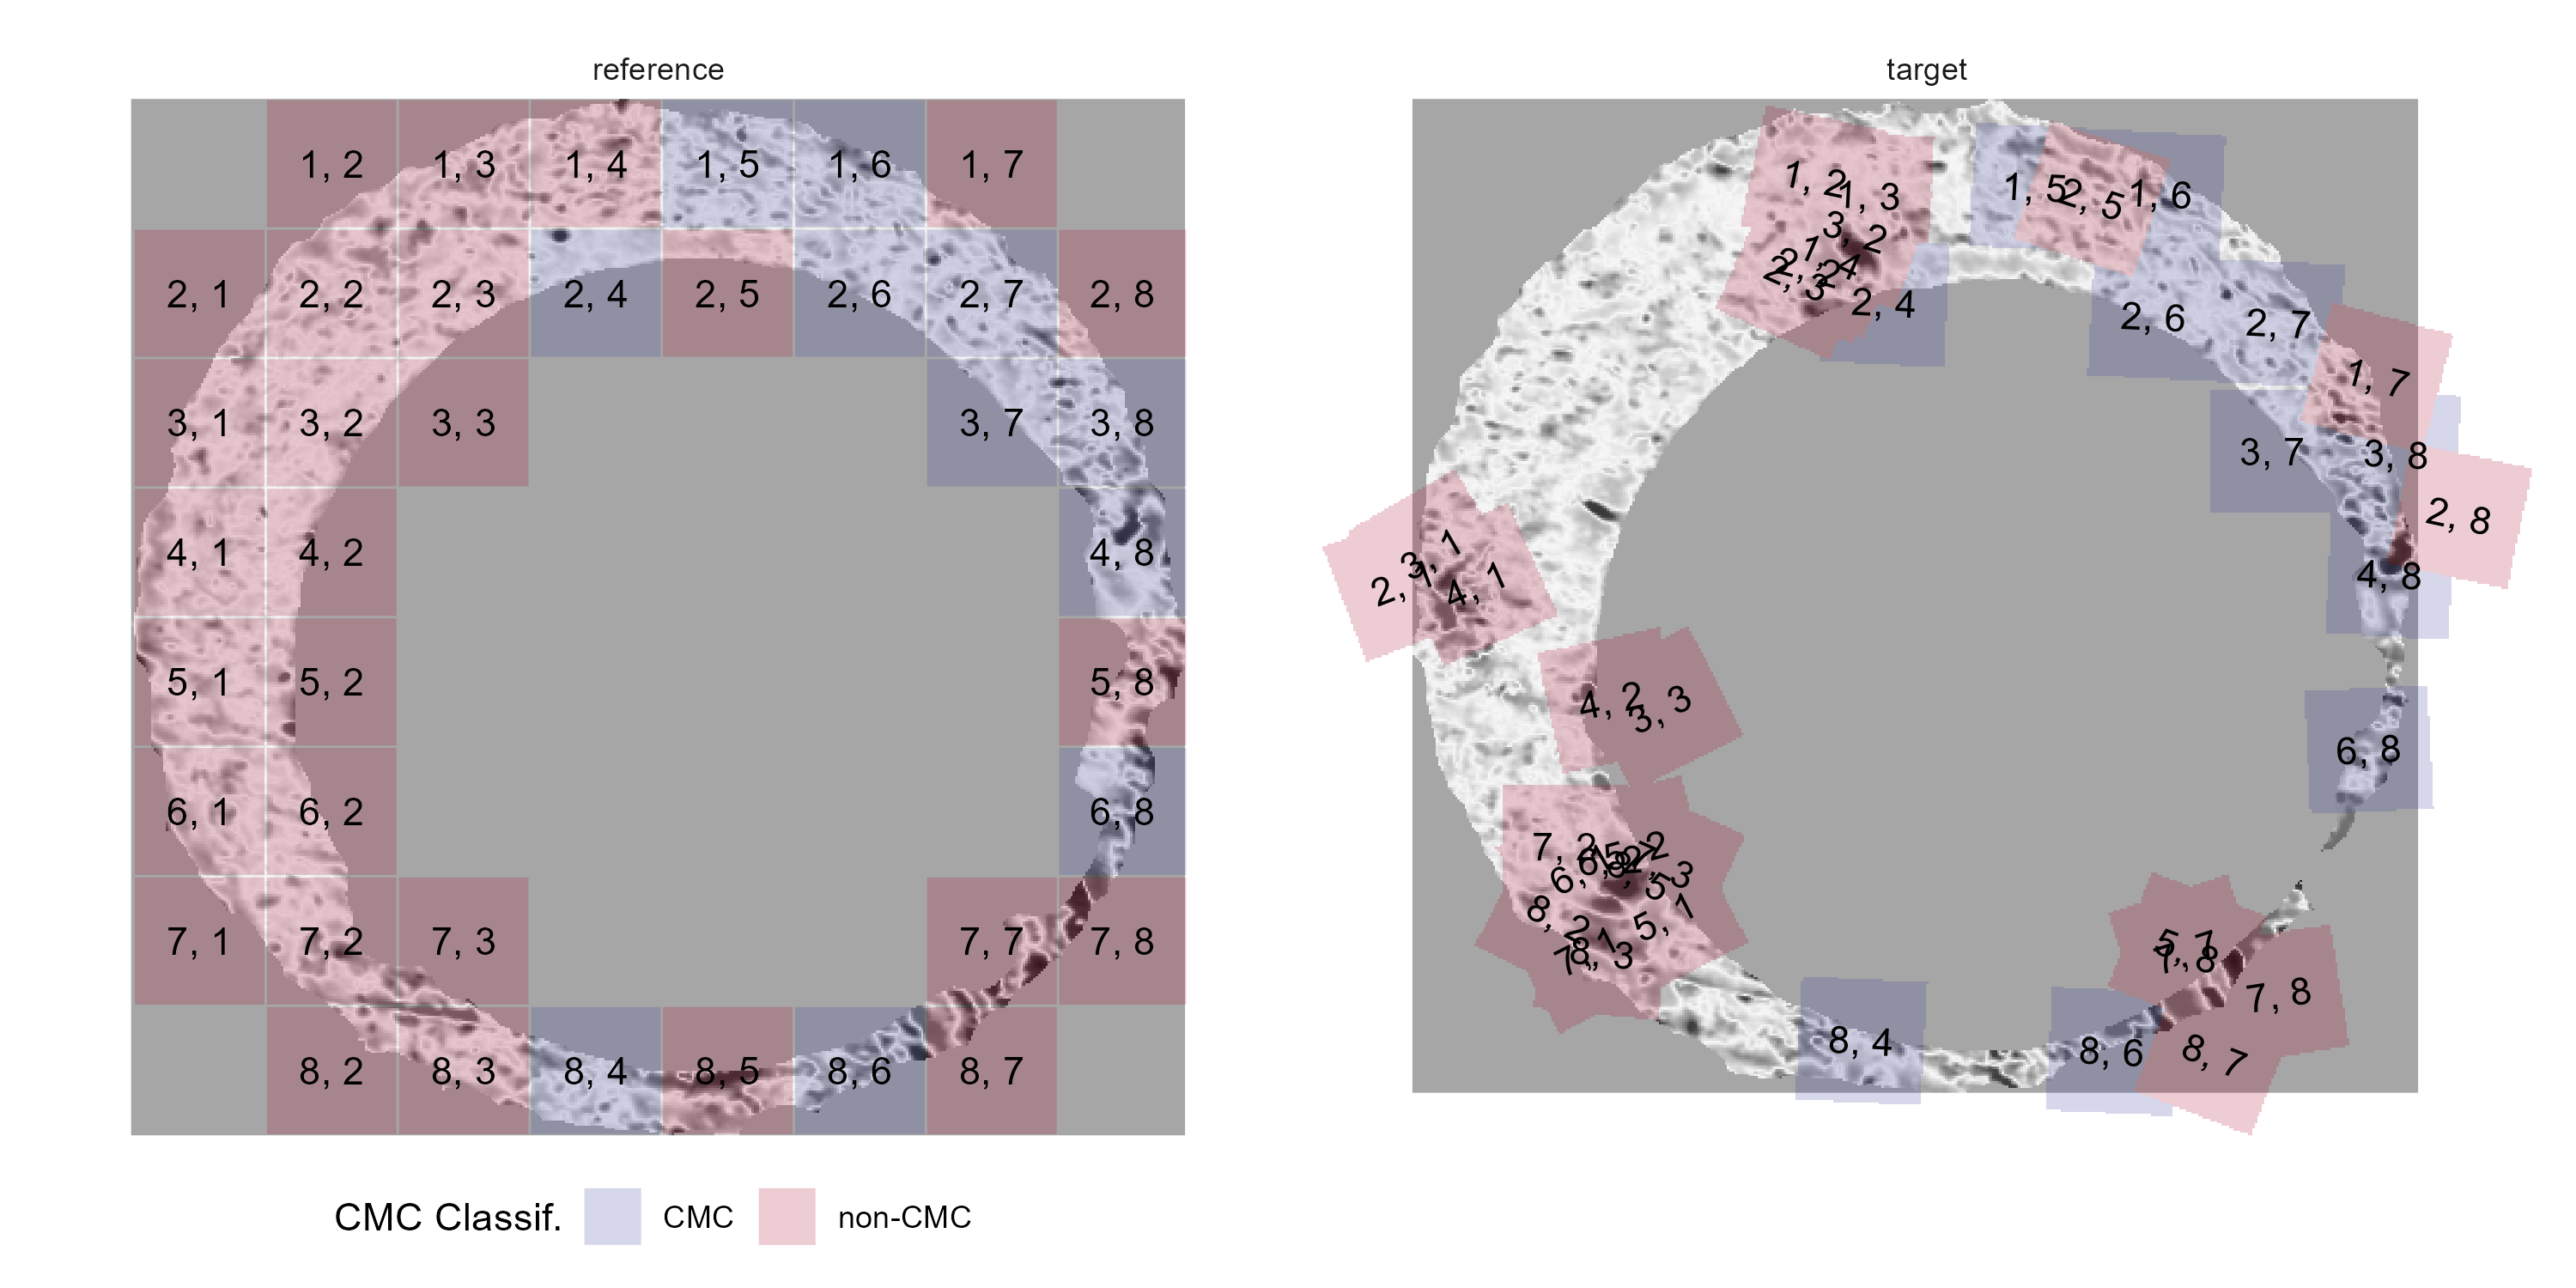
- Our approach: similarity score between 0 and 1 using a statistical model
What factors influence the final similarity score?
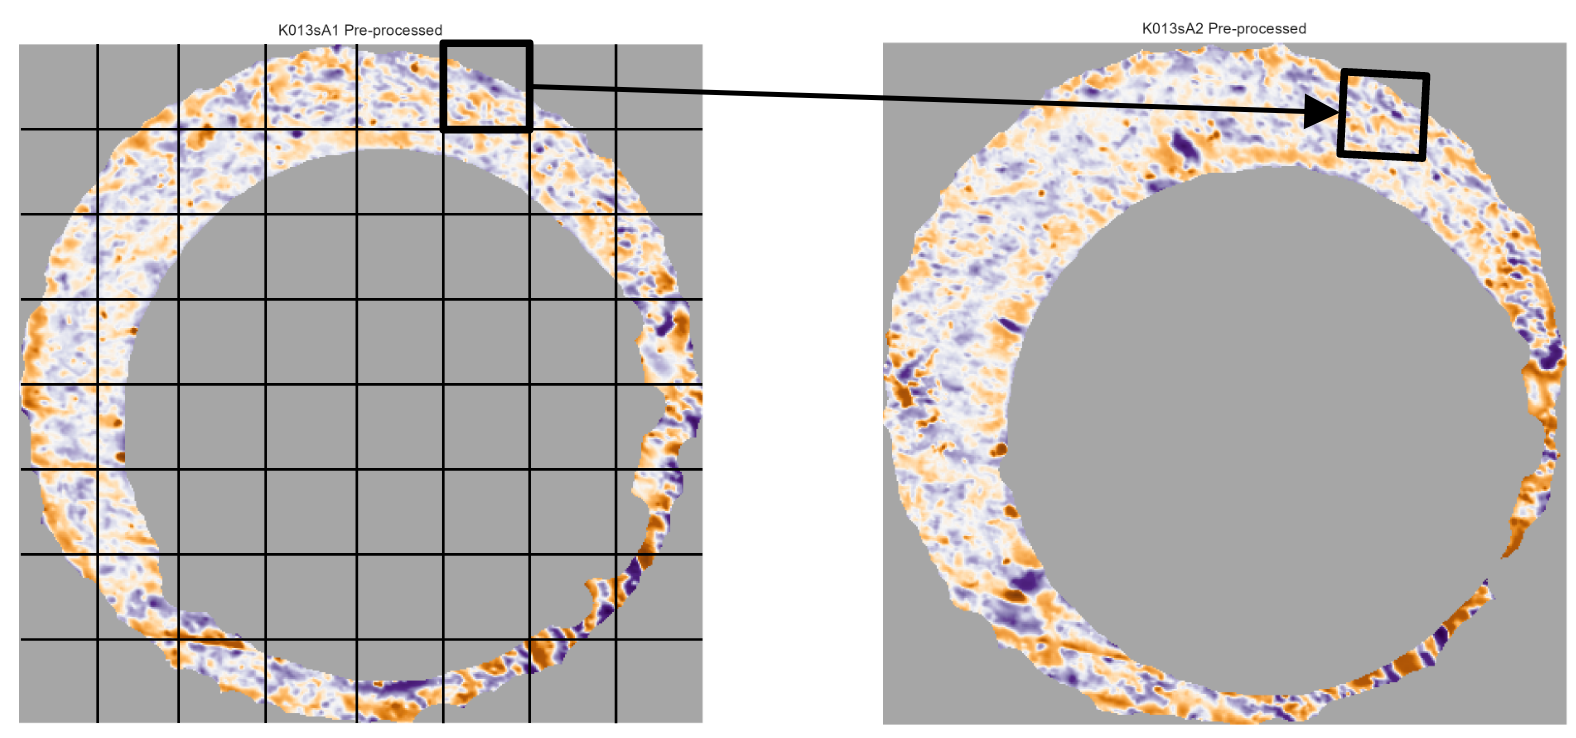
X3P Plot
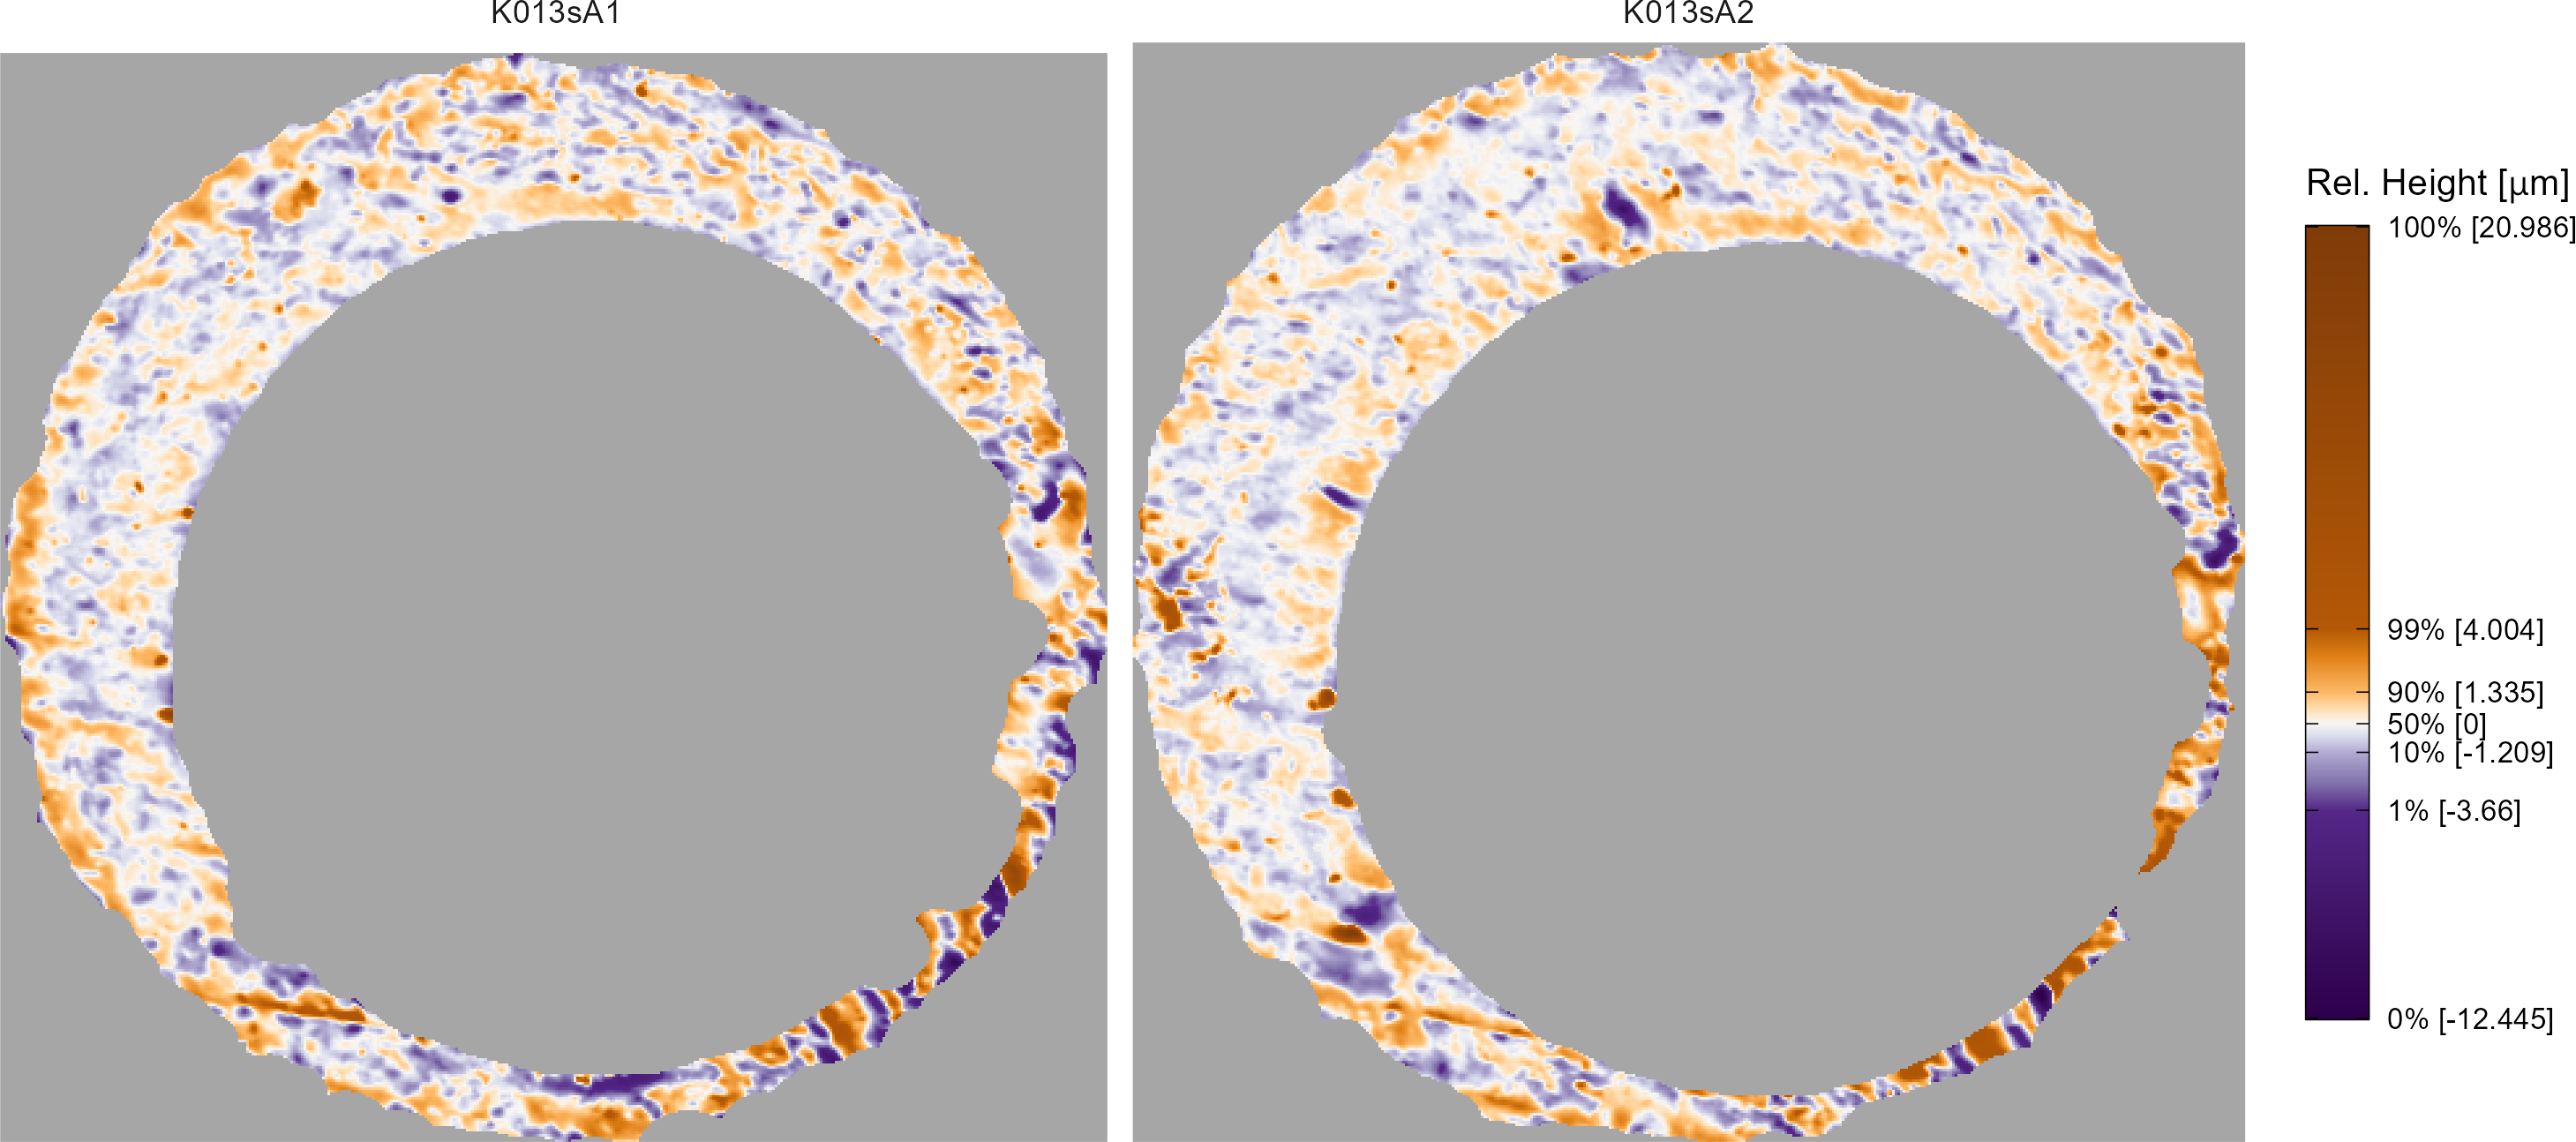
Emphasizes extreme values in scan that may need to be removed during pre-processing
Allows for comparison of multiple scans on the same color scheme
Map quantiles of surface values to a divergent color scheme

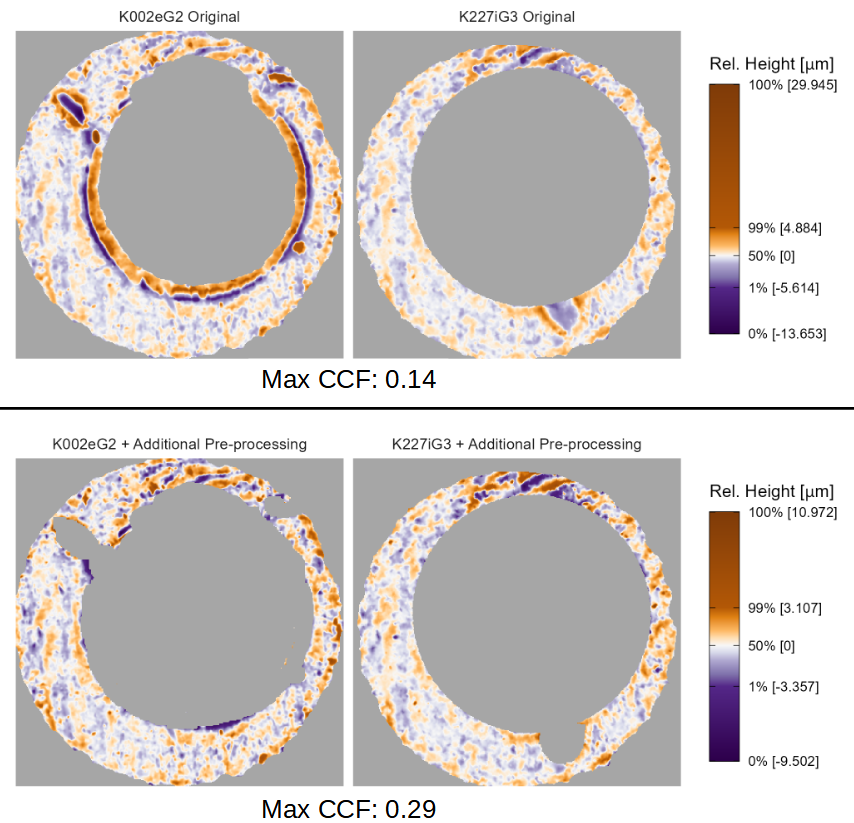
X3P Plot Pre-processing Example
- Useful for diagnosing when scans need additional pre-processing
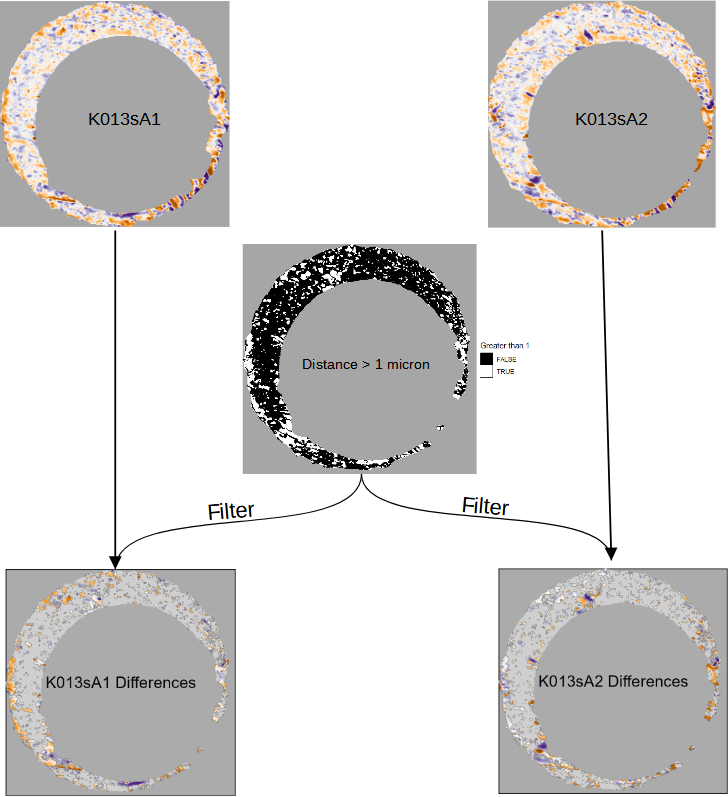
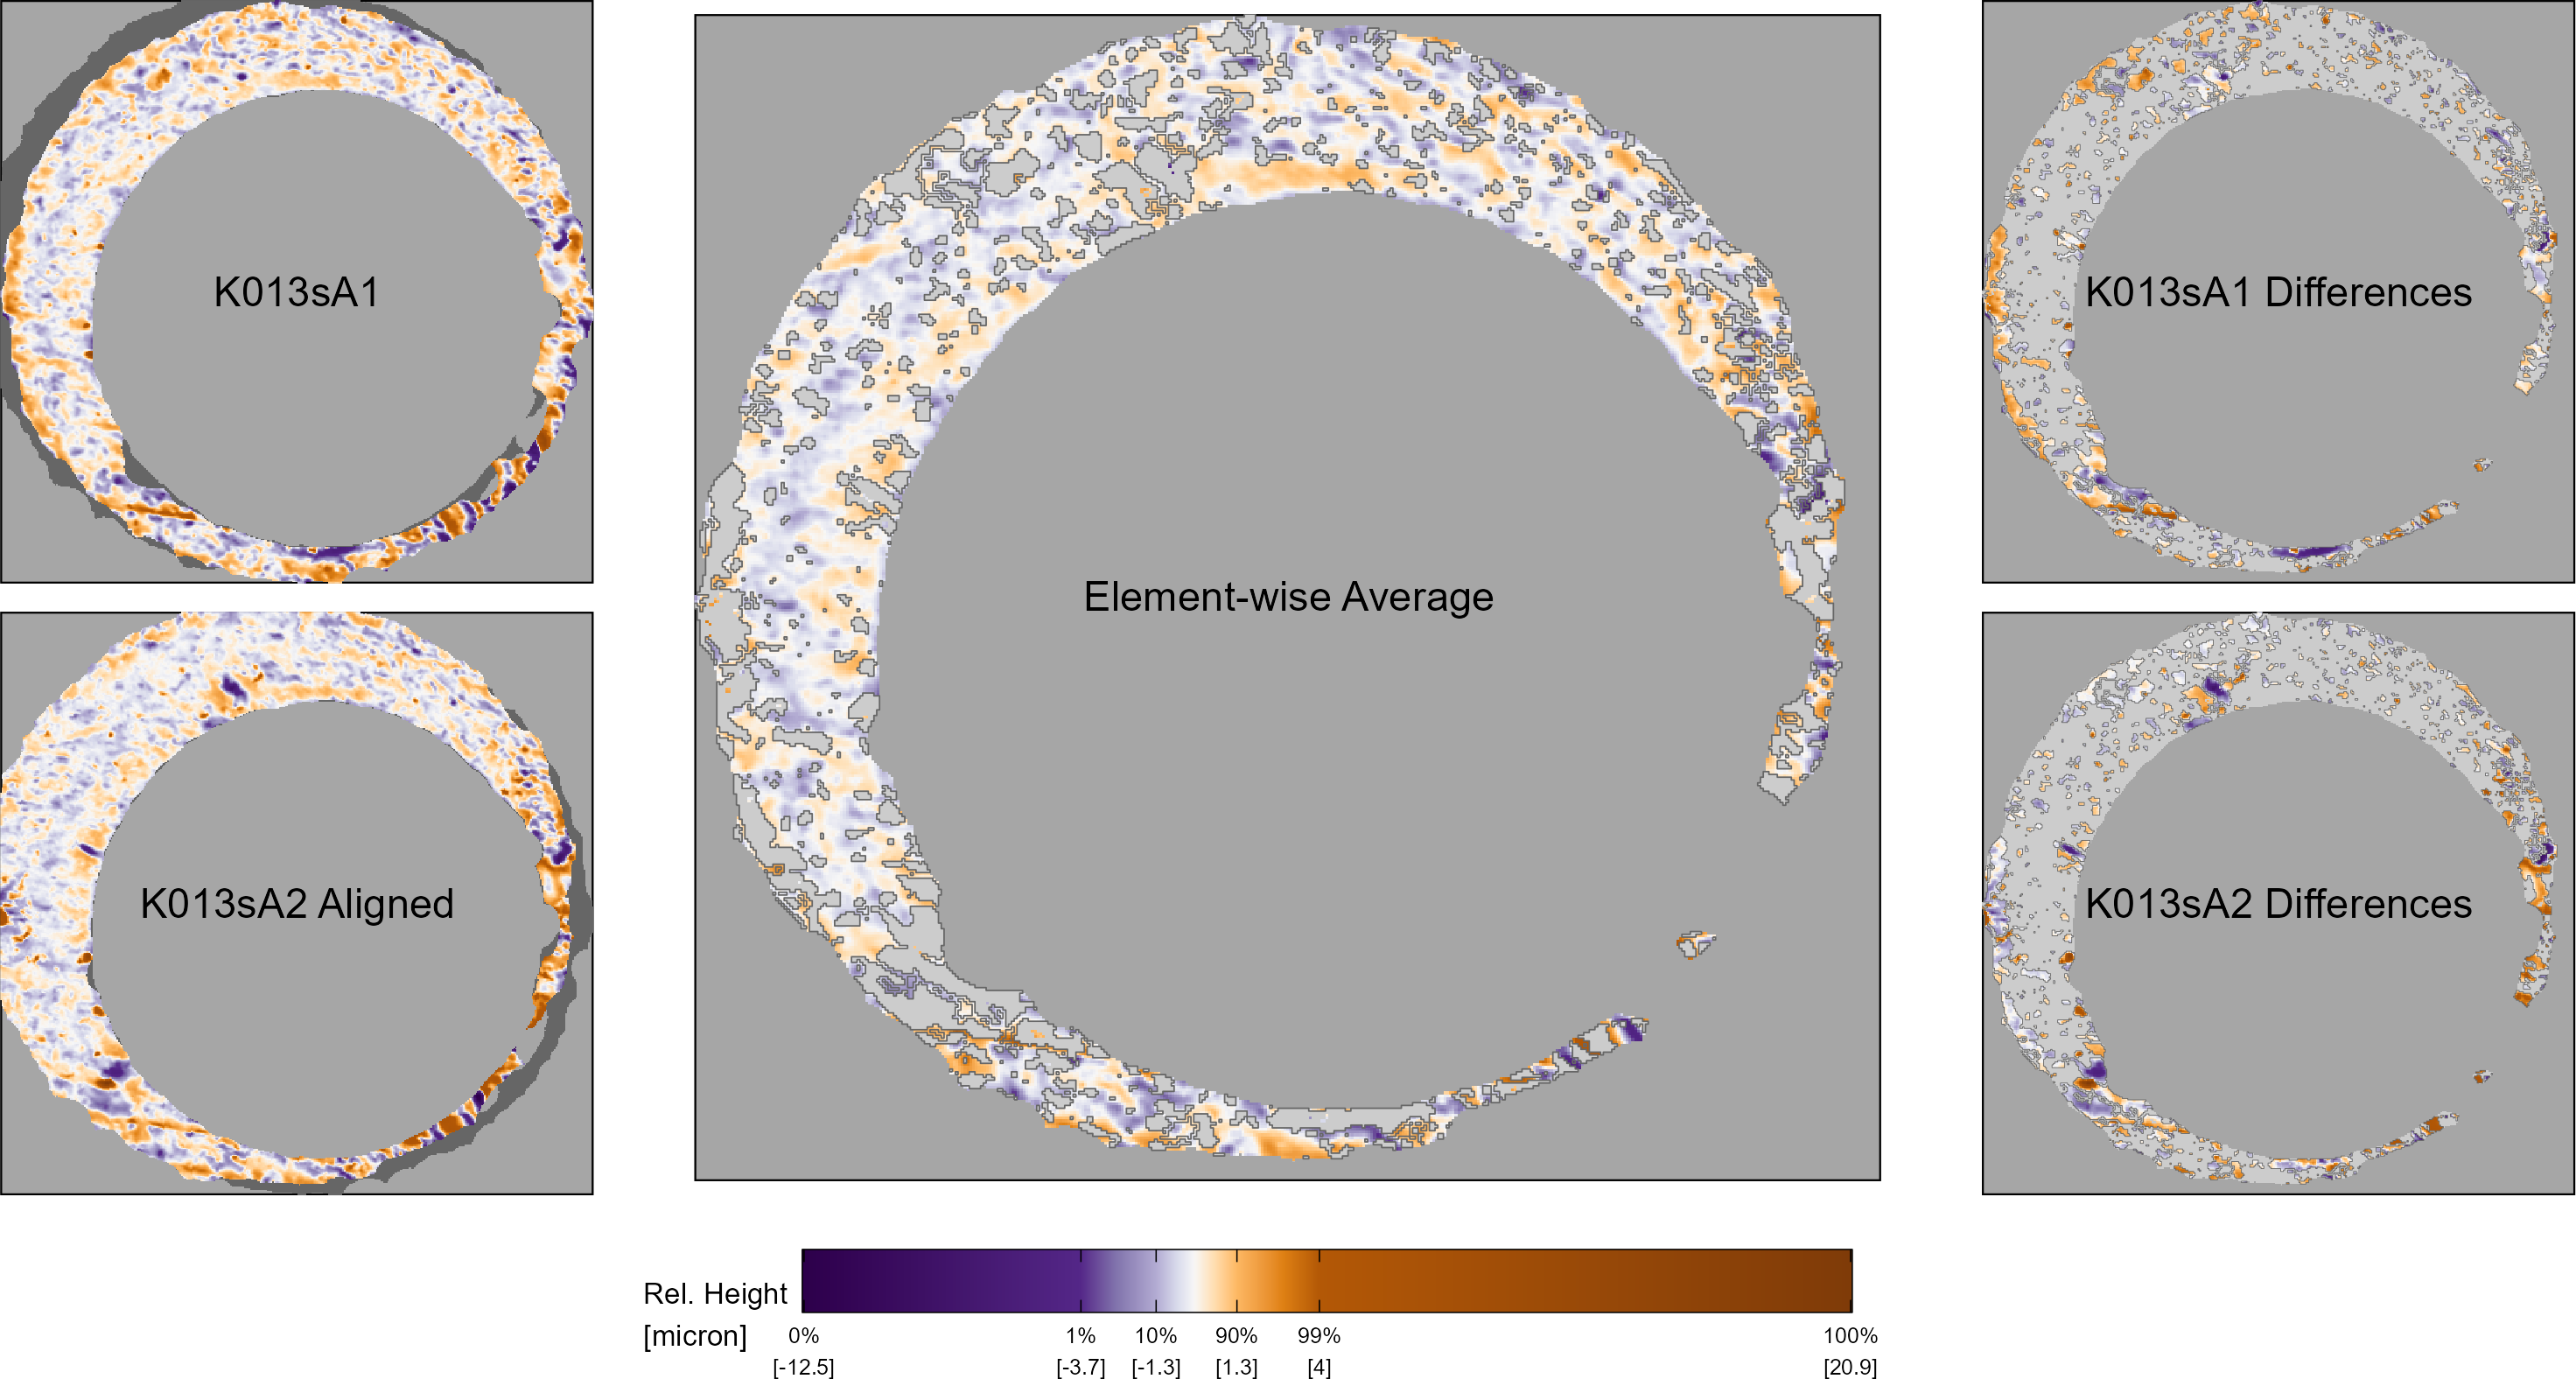
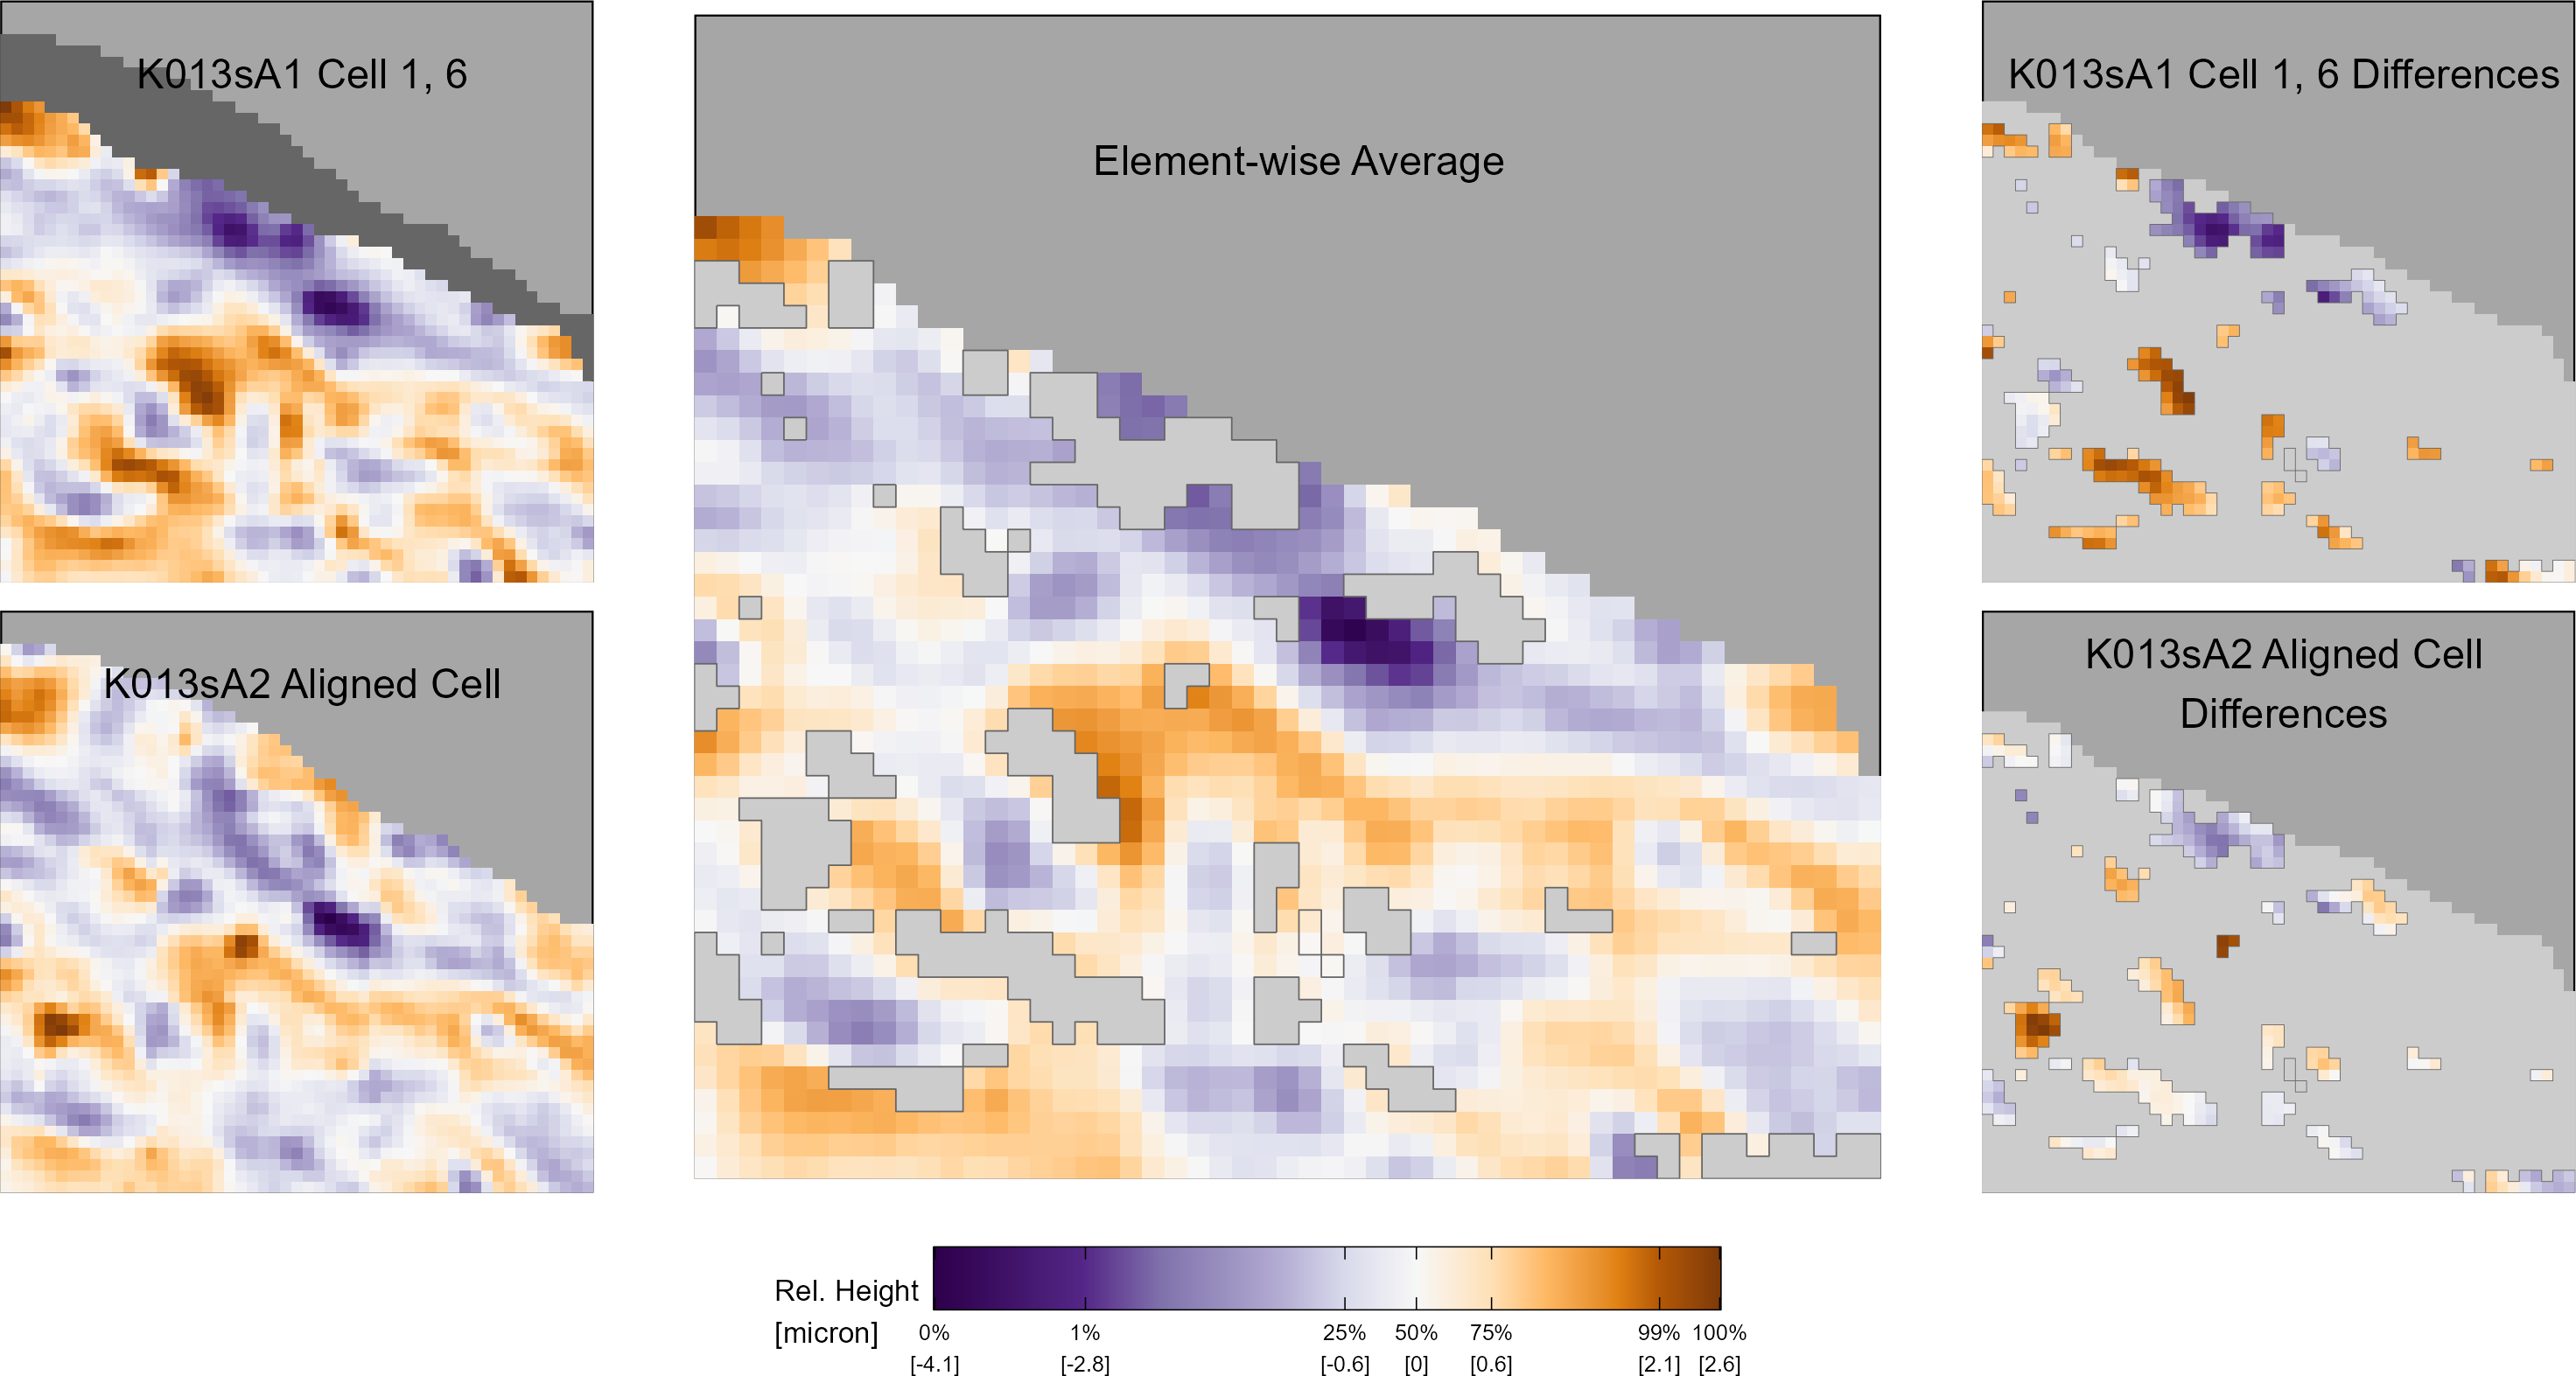
Comparison Plot
Separate aligned scans into similarities and differences
Useful for understanding a registration
- Similarities: Element-wise average between two scans after filtering elements that are less than 1 micron apart
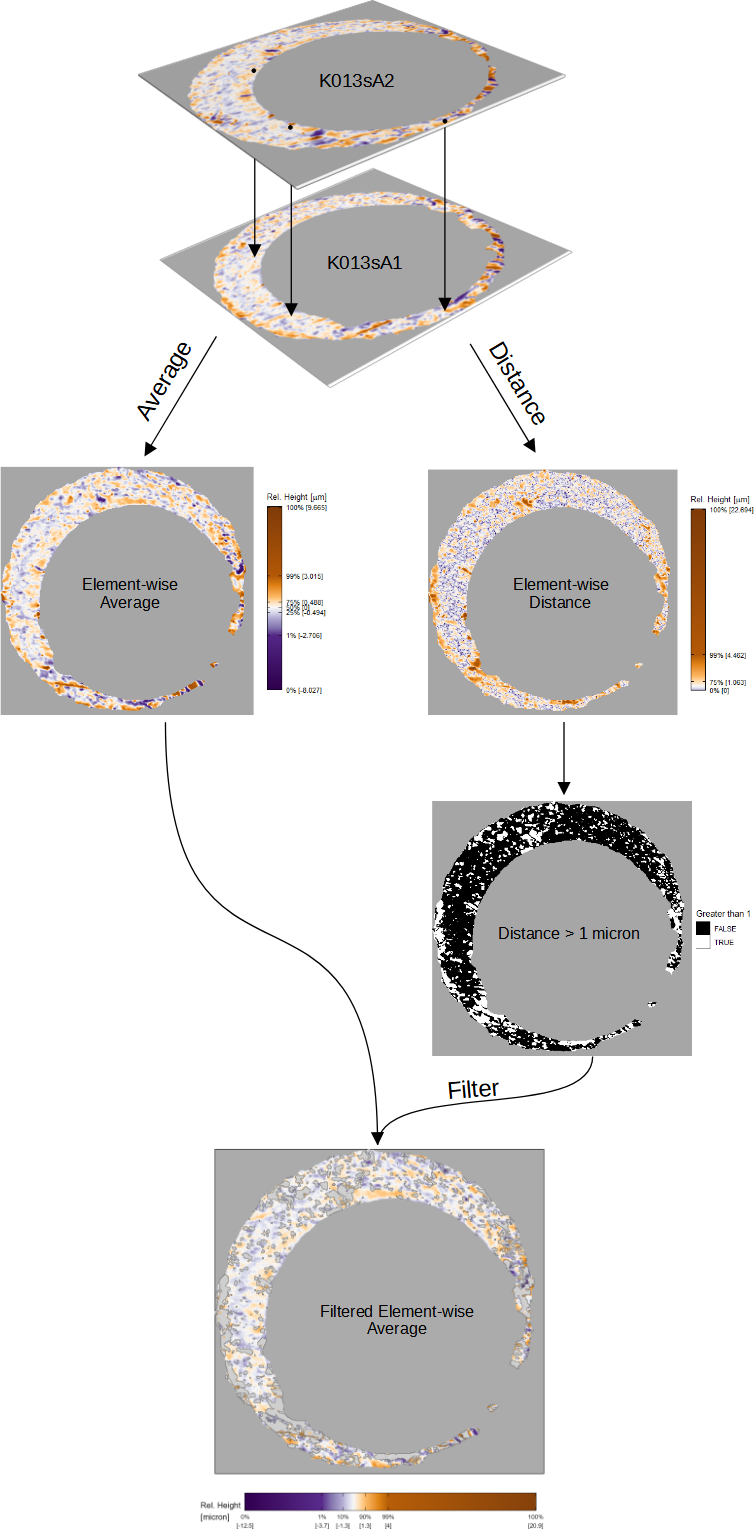
- Differences: Elements of both scans that are at least 1 micron apart
Full Scan Comparison Plot
Cell Comparison Plot
::: {.fragment fade-out fragment-index=1}
:::
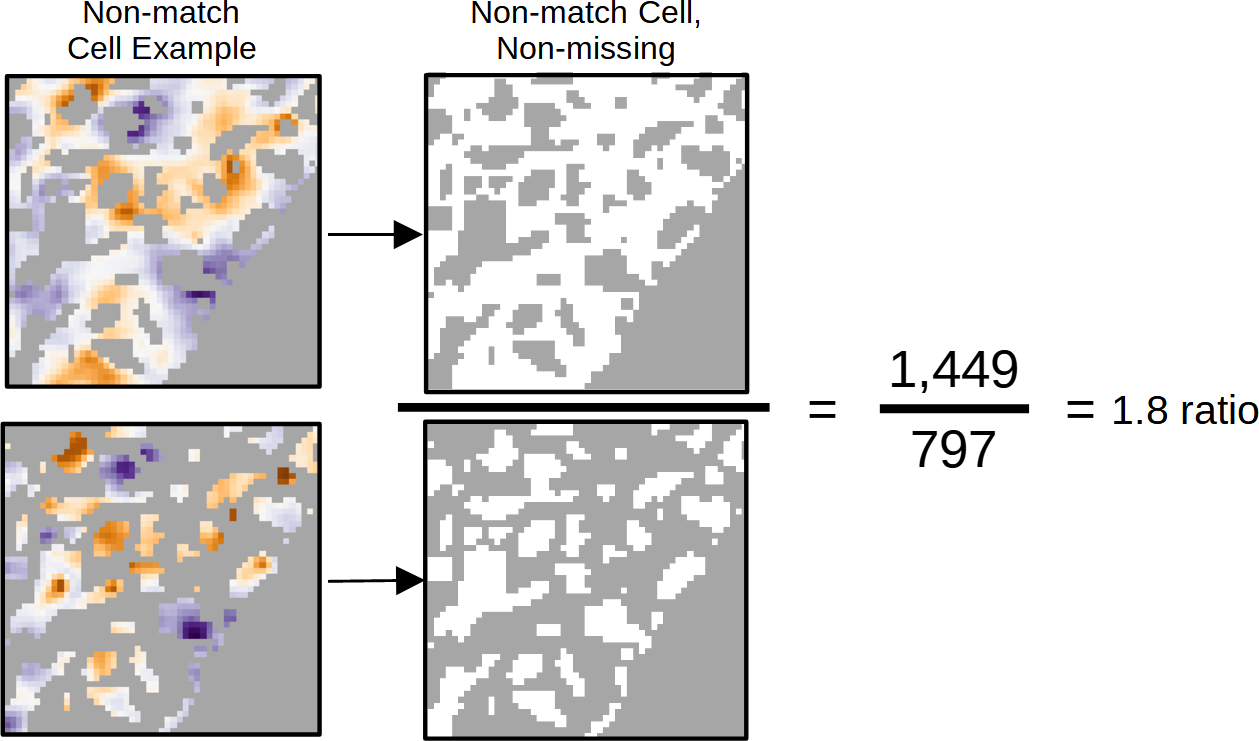
Similarities vs. Differences Ratio
- There should be more similarities than differences
Ratio between number of similar vs. different observations
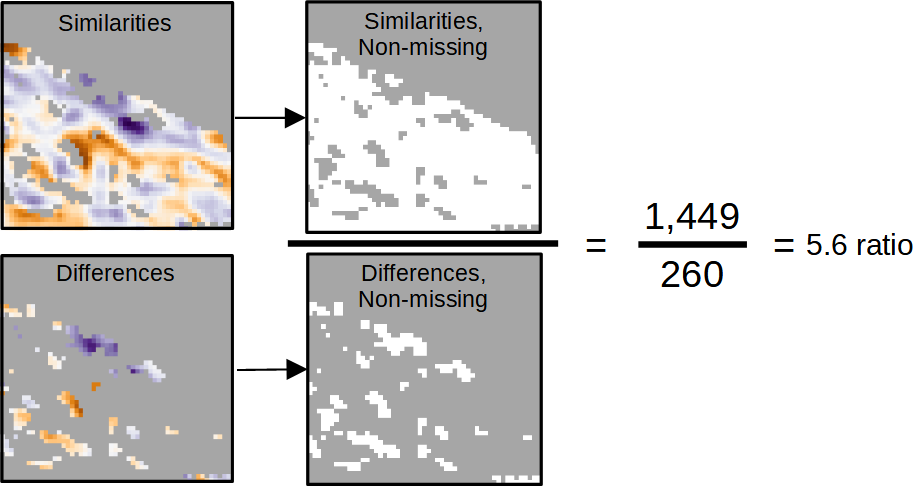
Compare to a non-match cell comparison:
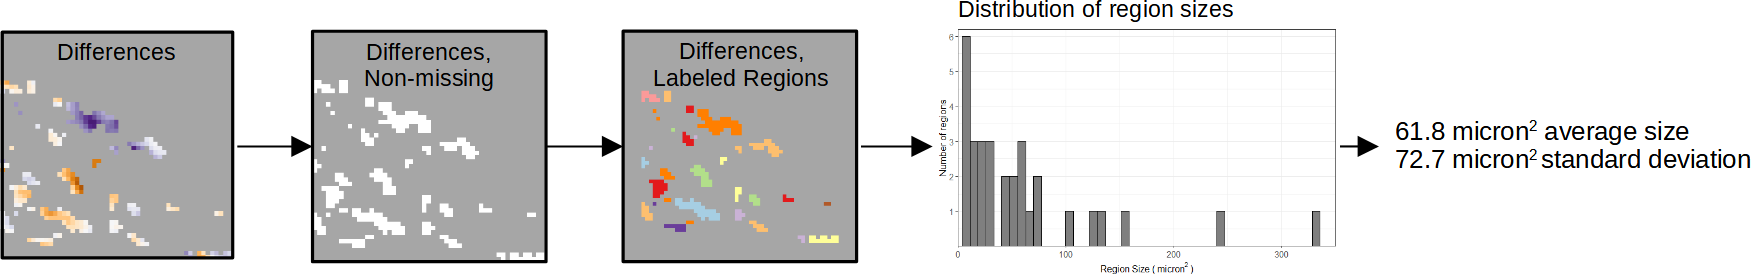
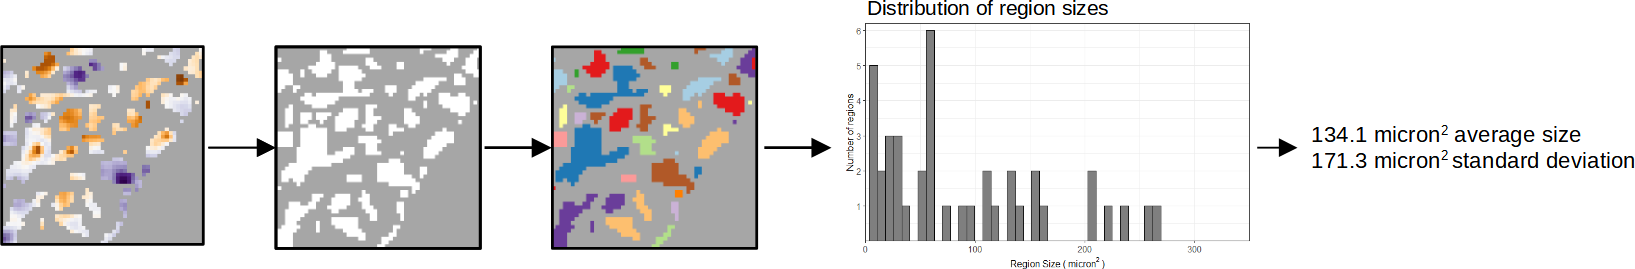
Different Region Size
- The different regions should be relatively small
Size of the different regions
Compare to a non-match cell comparison:
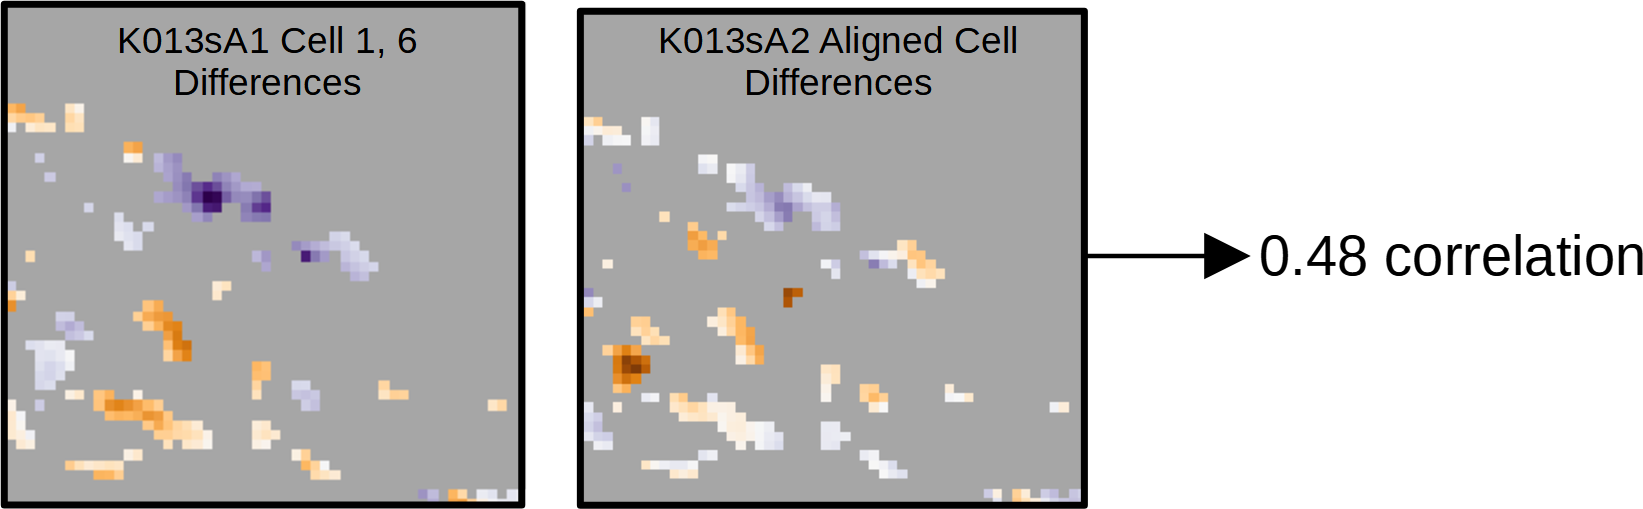
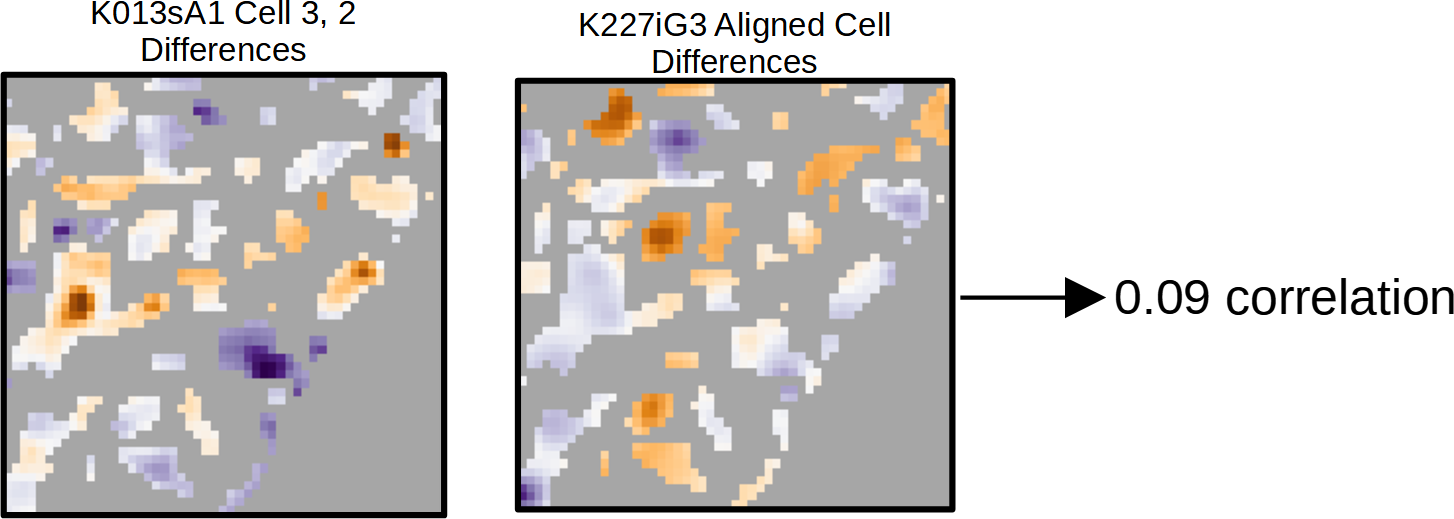
Different Region Correlation
- The surface values of the different regions should follow similar trends
Correlation between the different regions of the two scans
Compare to a non-match cell comparison:
Automatic Cartridge Evidence Scoring
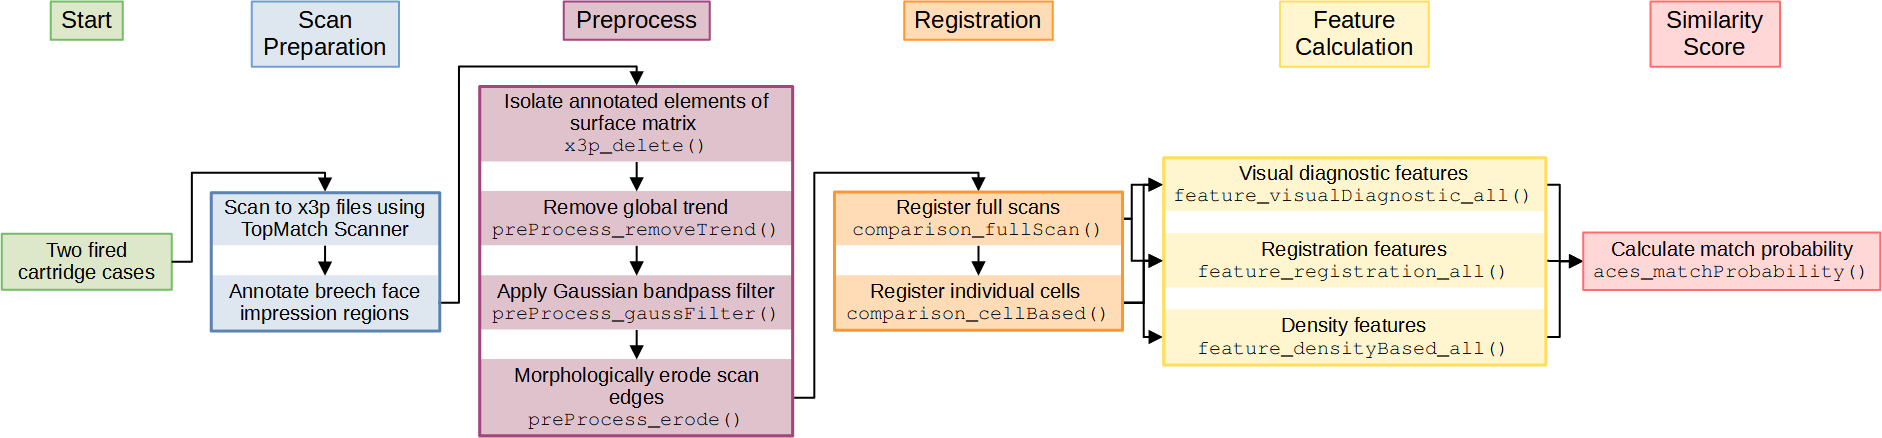
- Comparison algorithm that pre-processes, compares, and scores two cartridge case scans
- Computes 19 numerical features for each cartridge case pair
- Computes similarity score between 0 and 1 for a cartridge case pair using trained statistical model
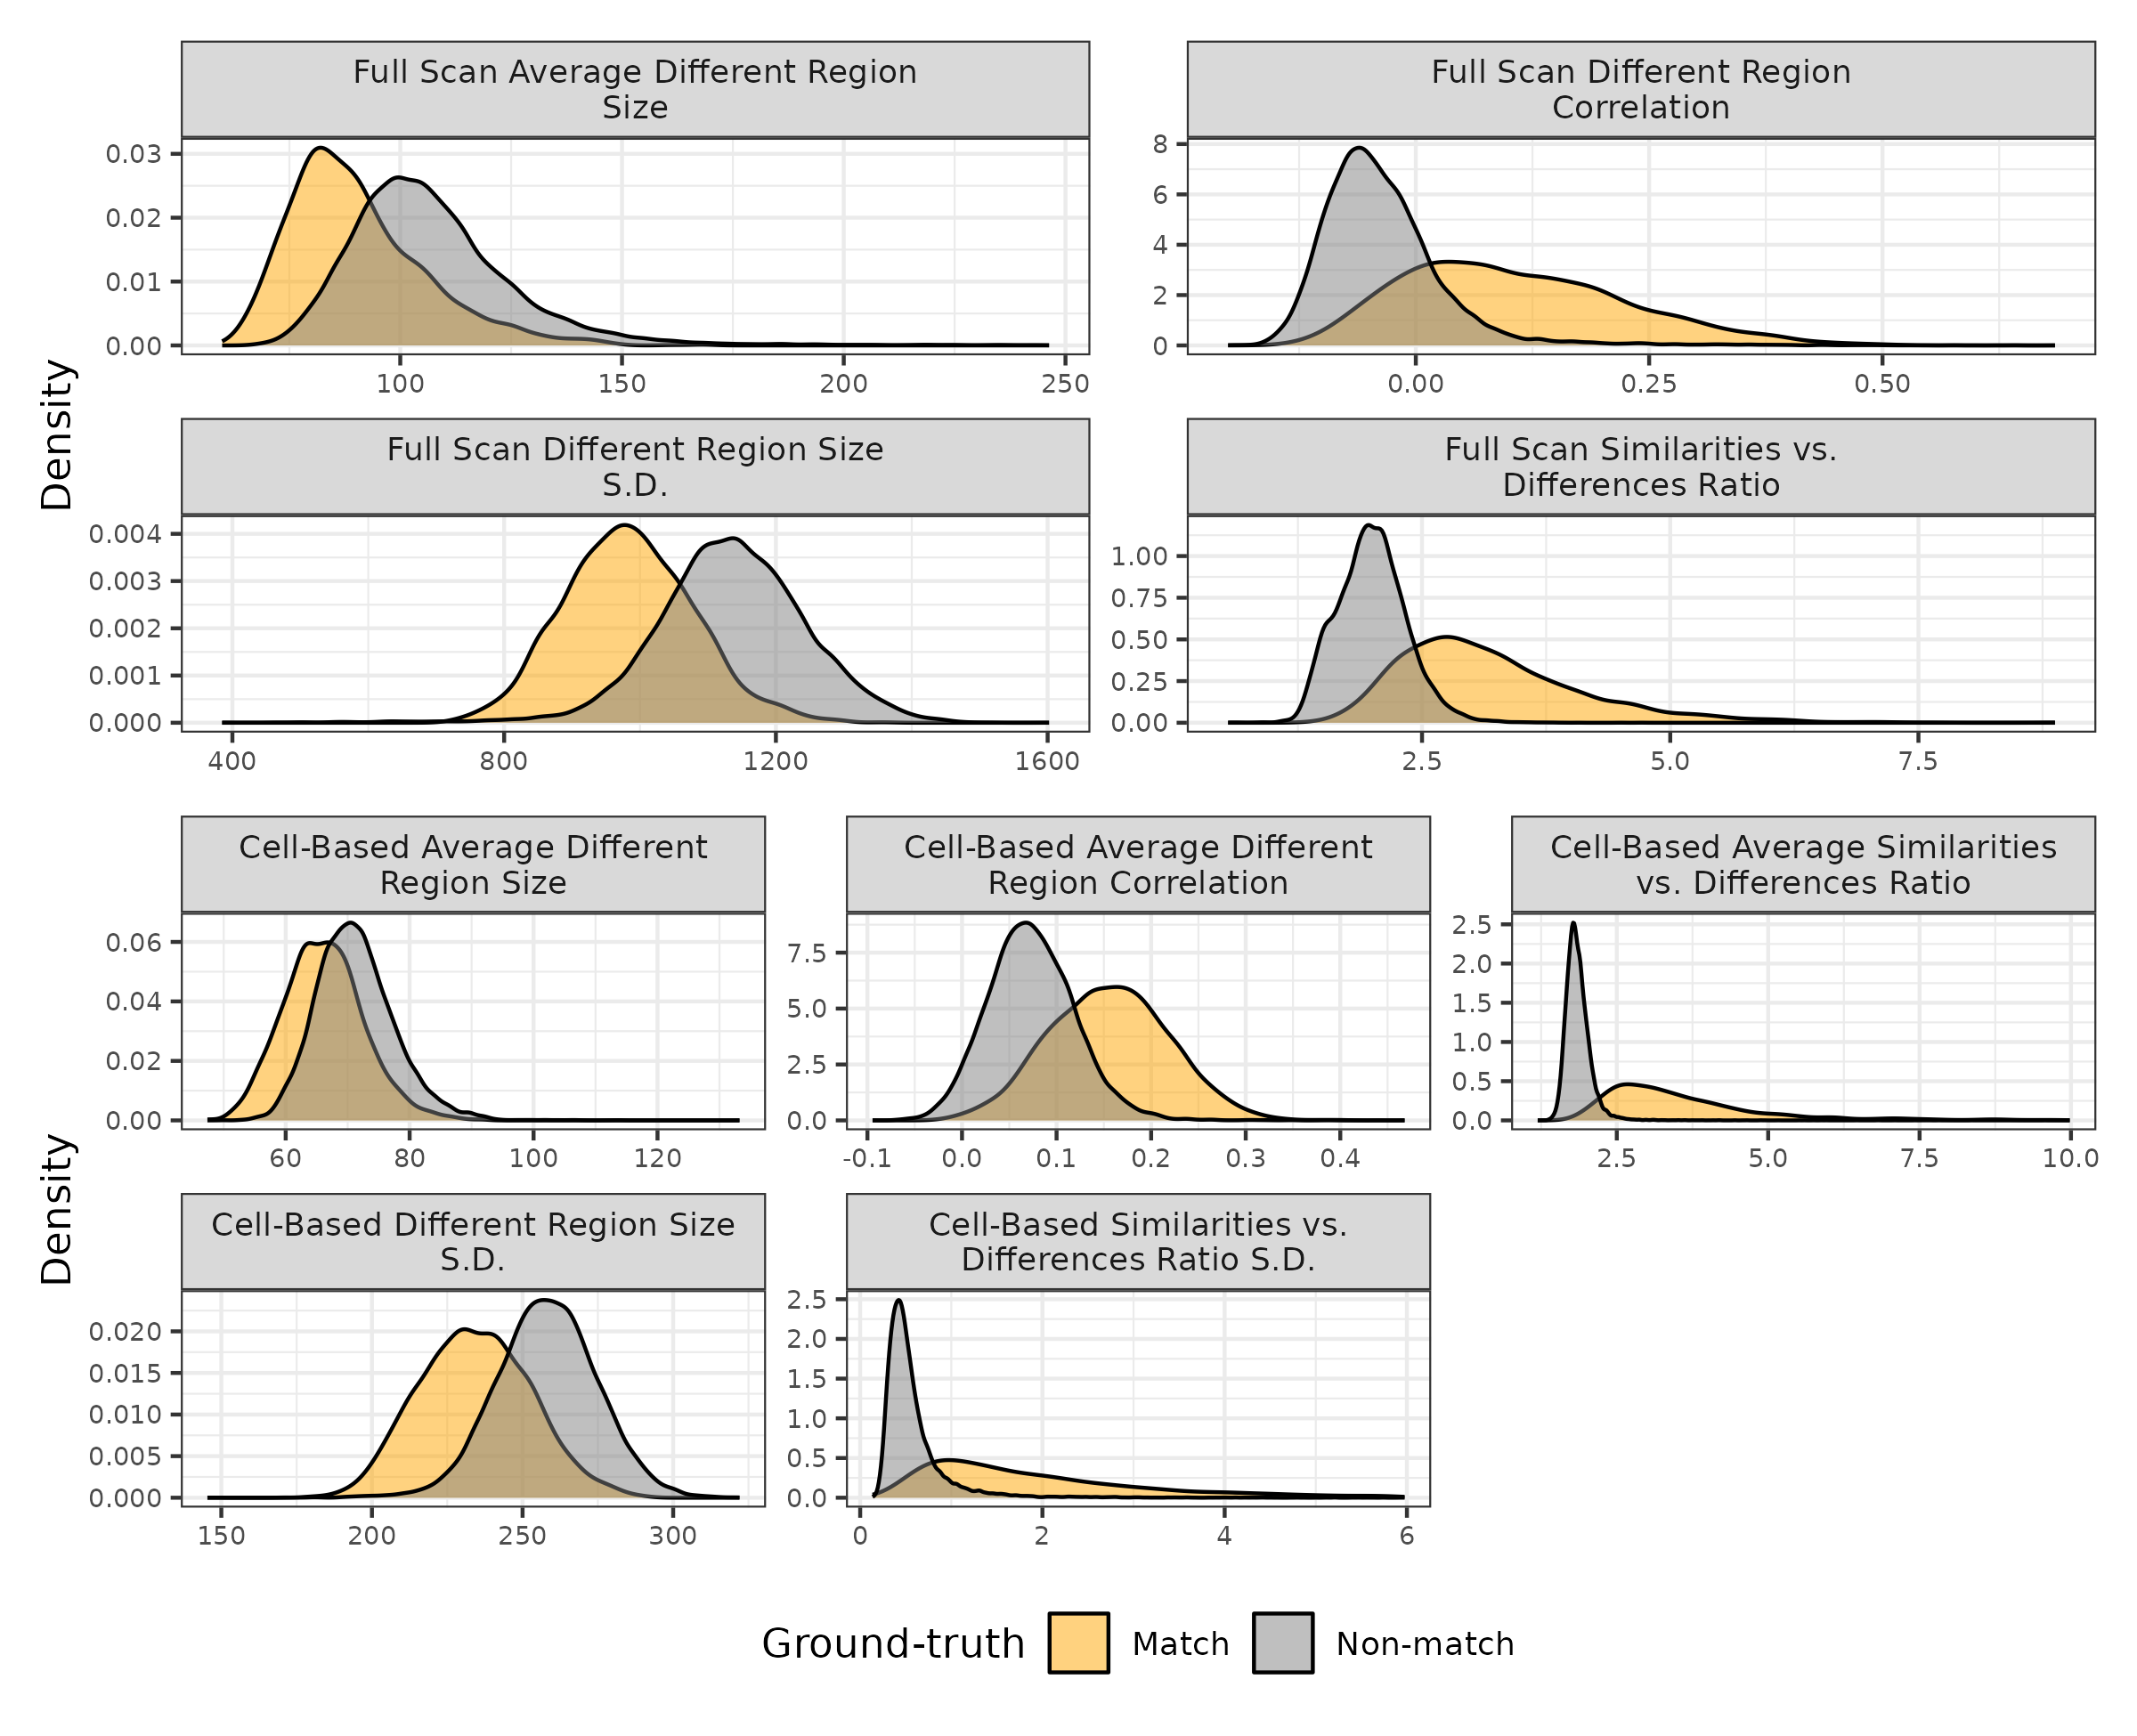
Visual Diagnostic Features
- Use visual diagnostic statistics discussed earlier as numerical features
Features:
From the full scan comparison:
Similarities vs. differences ratio
Average and standard deviation of different region sizes
Different region correlation
From cell-based comparison:
Average and standard deviation of similarities vs. differences ratios
Average and standard deviation of different region sizes
Average different region correlation
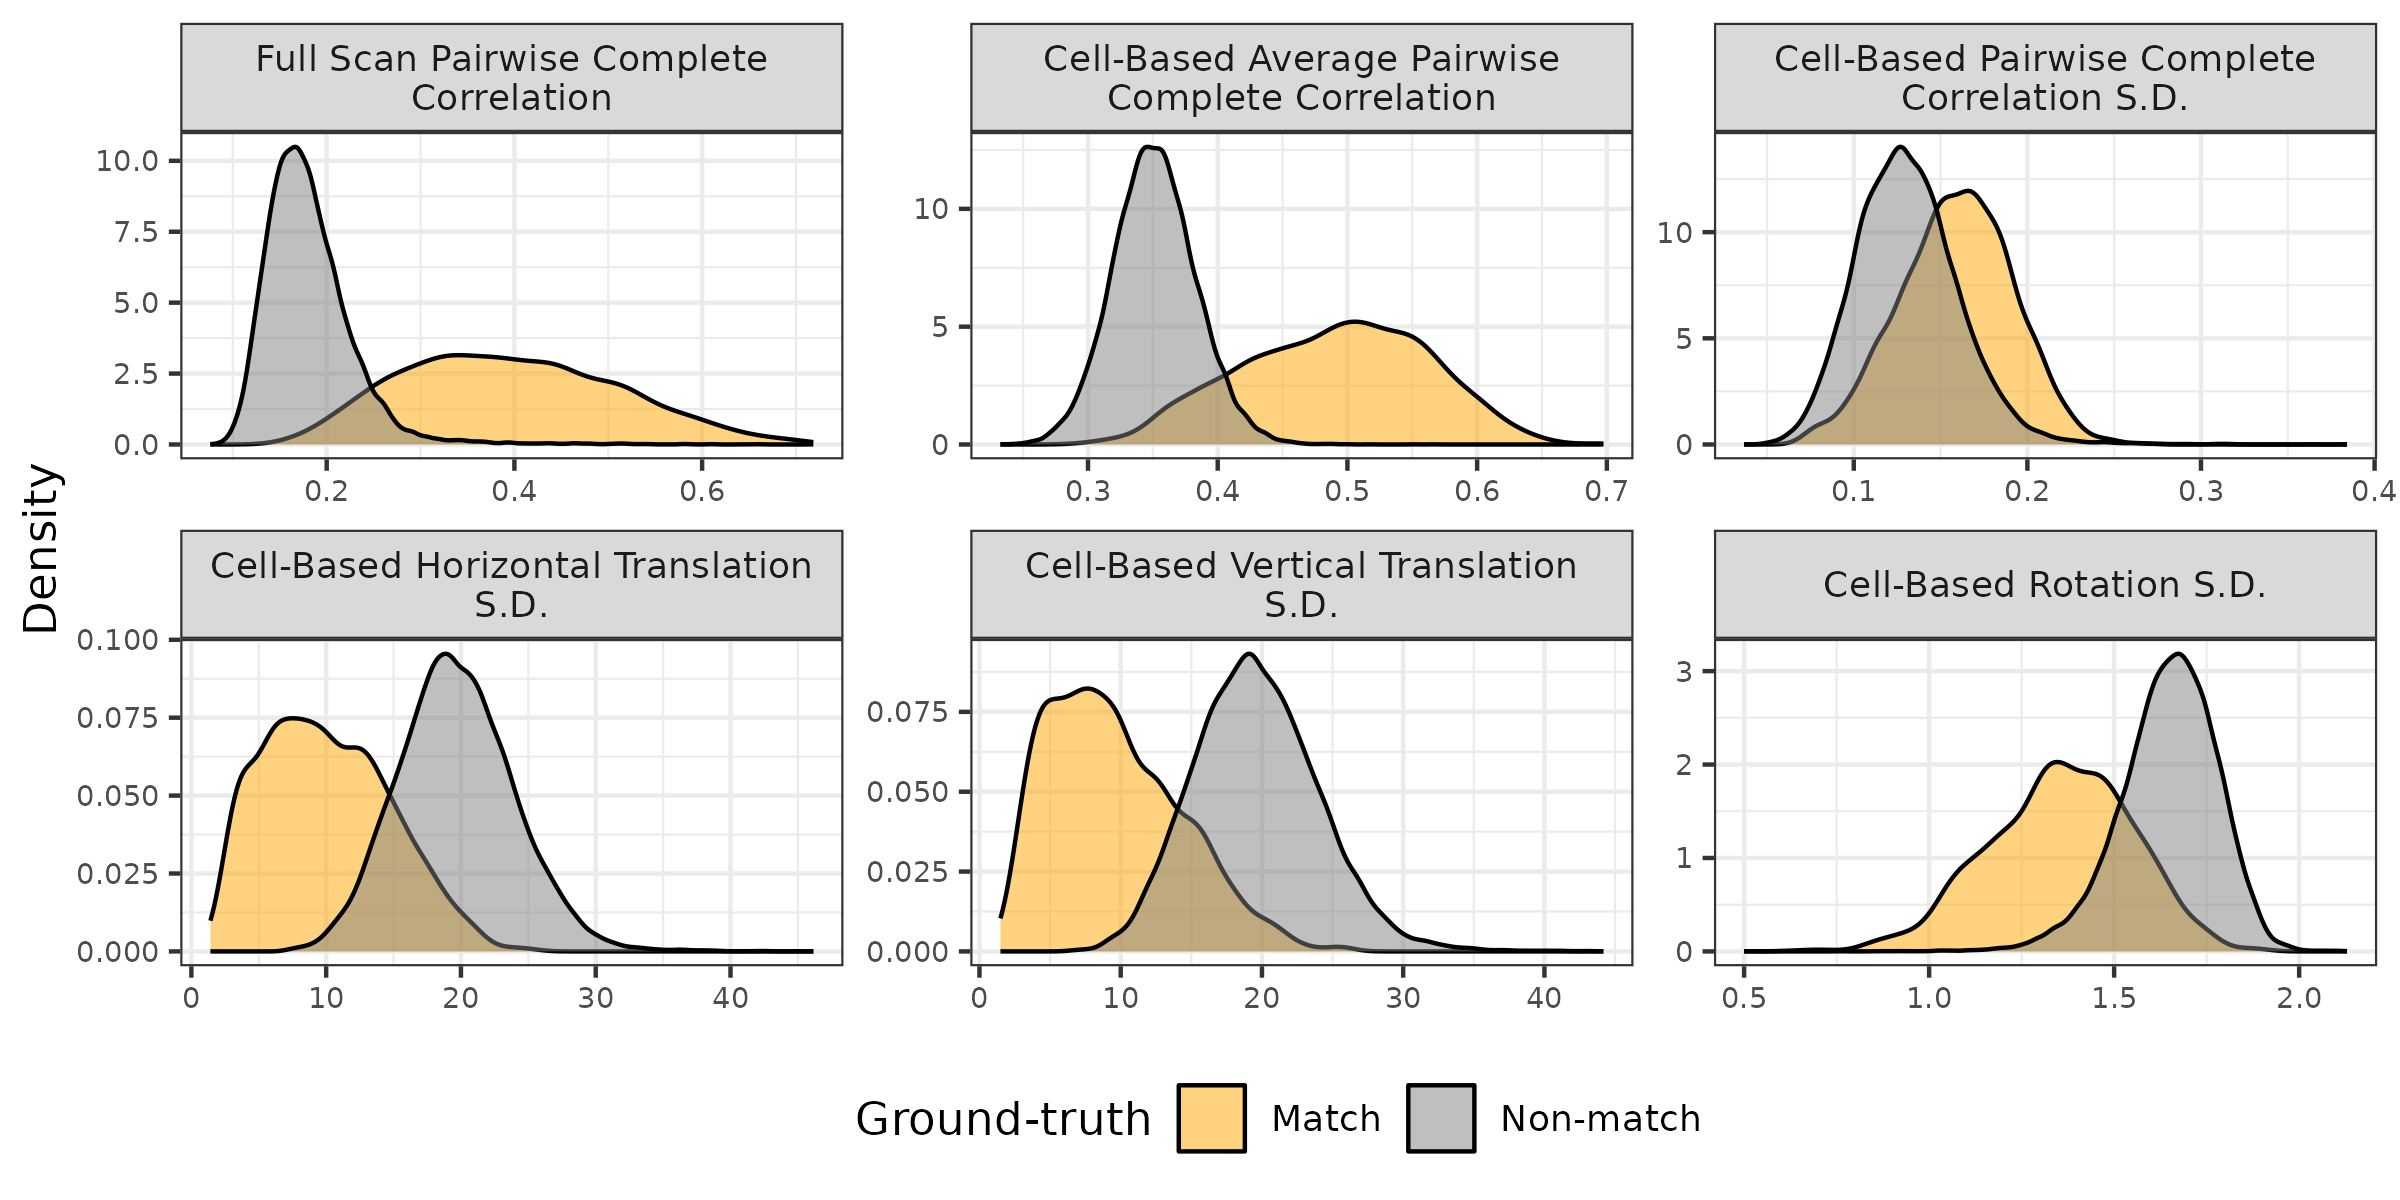
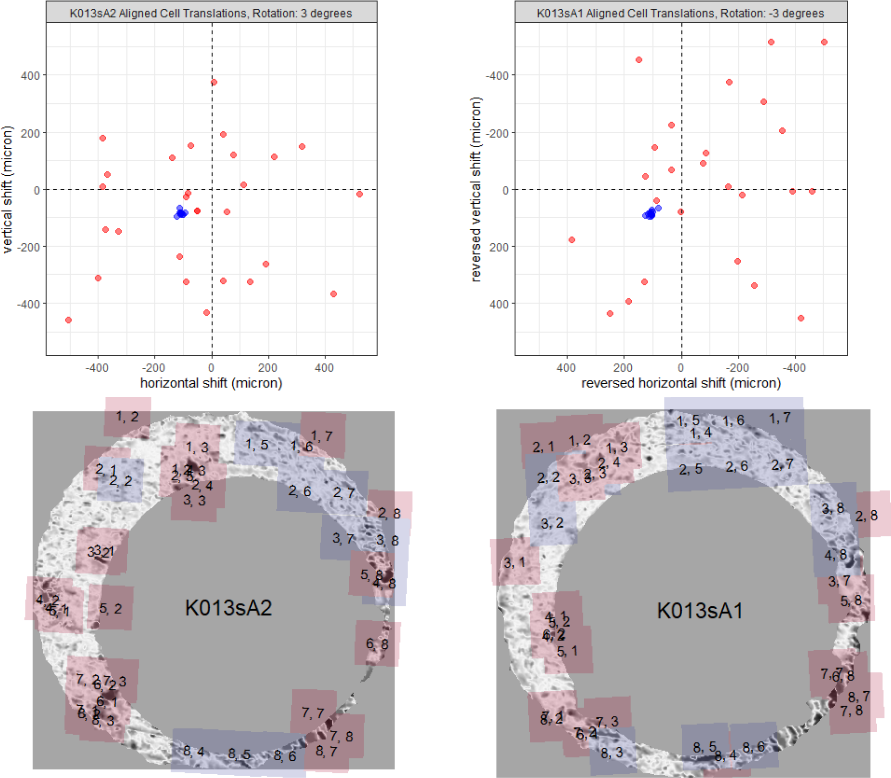
Registration-based Features
For a matching cartridge case pair…
Correlation should be large at the full scan and cell levels
Cells should “agree” on a particular registration
Compute summary statistics of full-scan and cell-based registration results
Features:
Correlation from full scan comparison
Mean and standard deviation of correlations from cell comparisons
Standard deviation of cell-based registration values (horizontal/vertical translations & rotation)
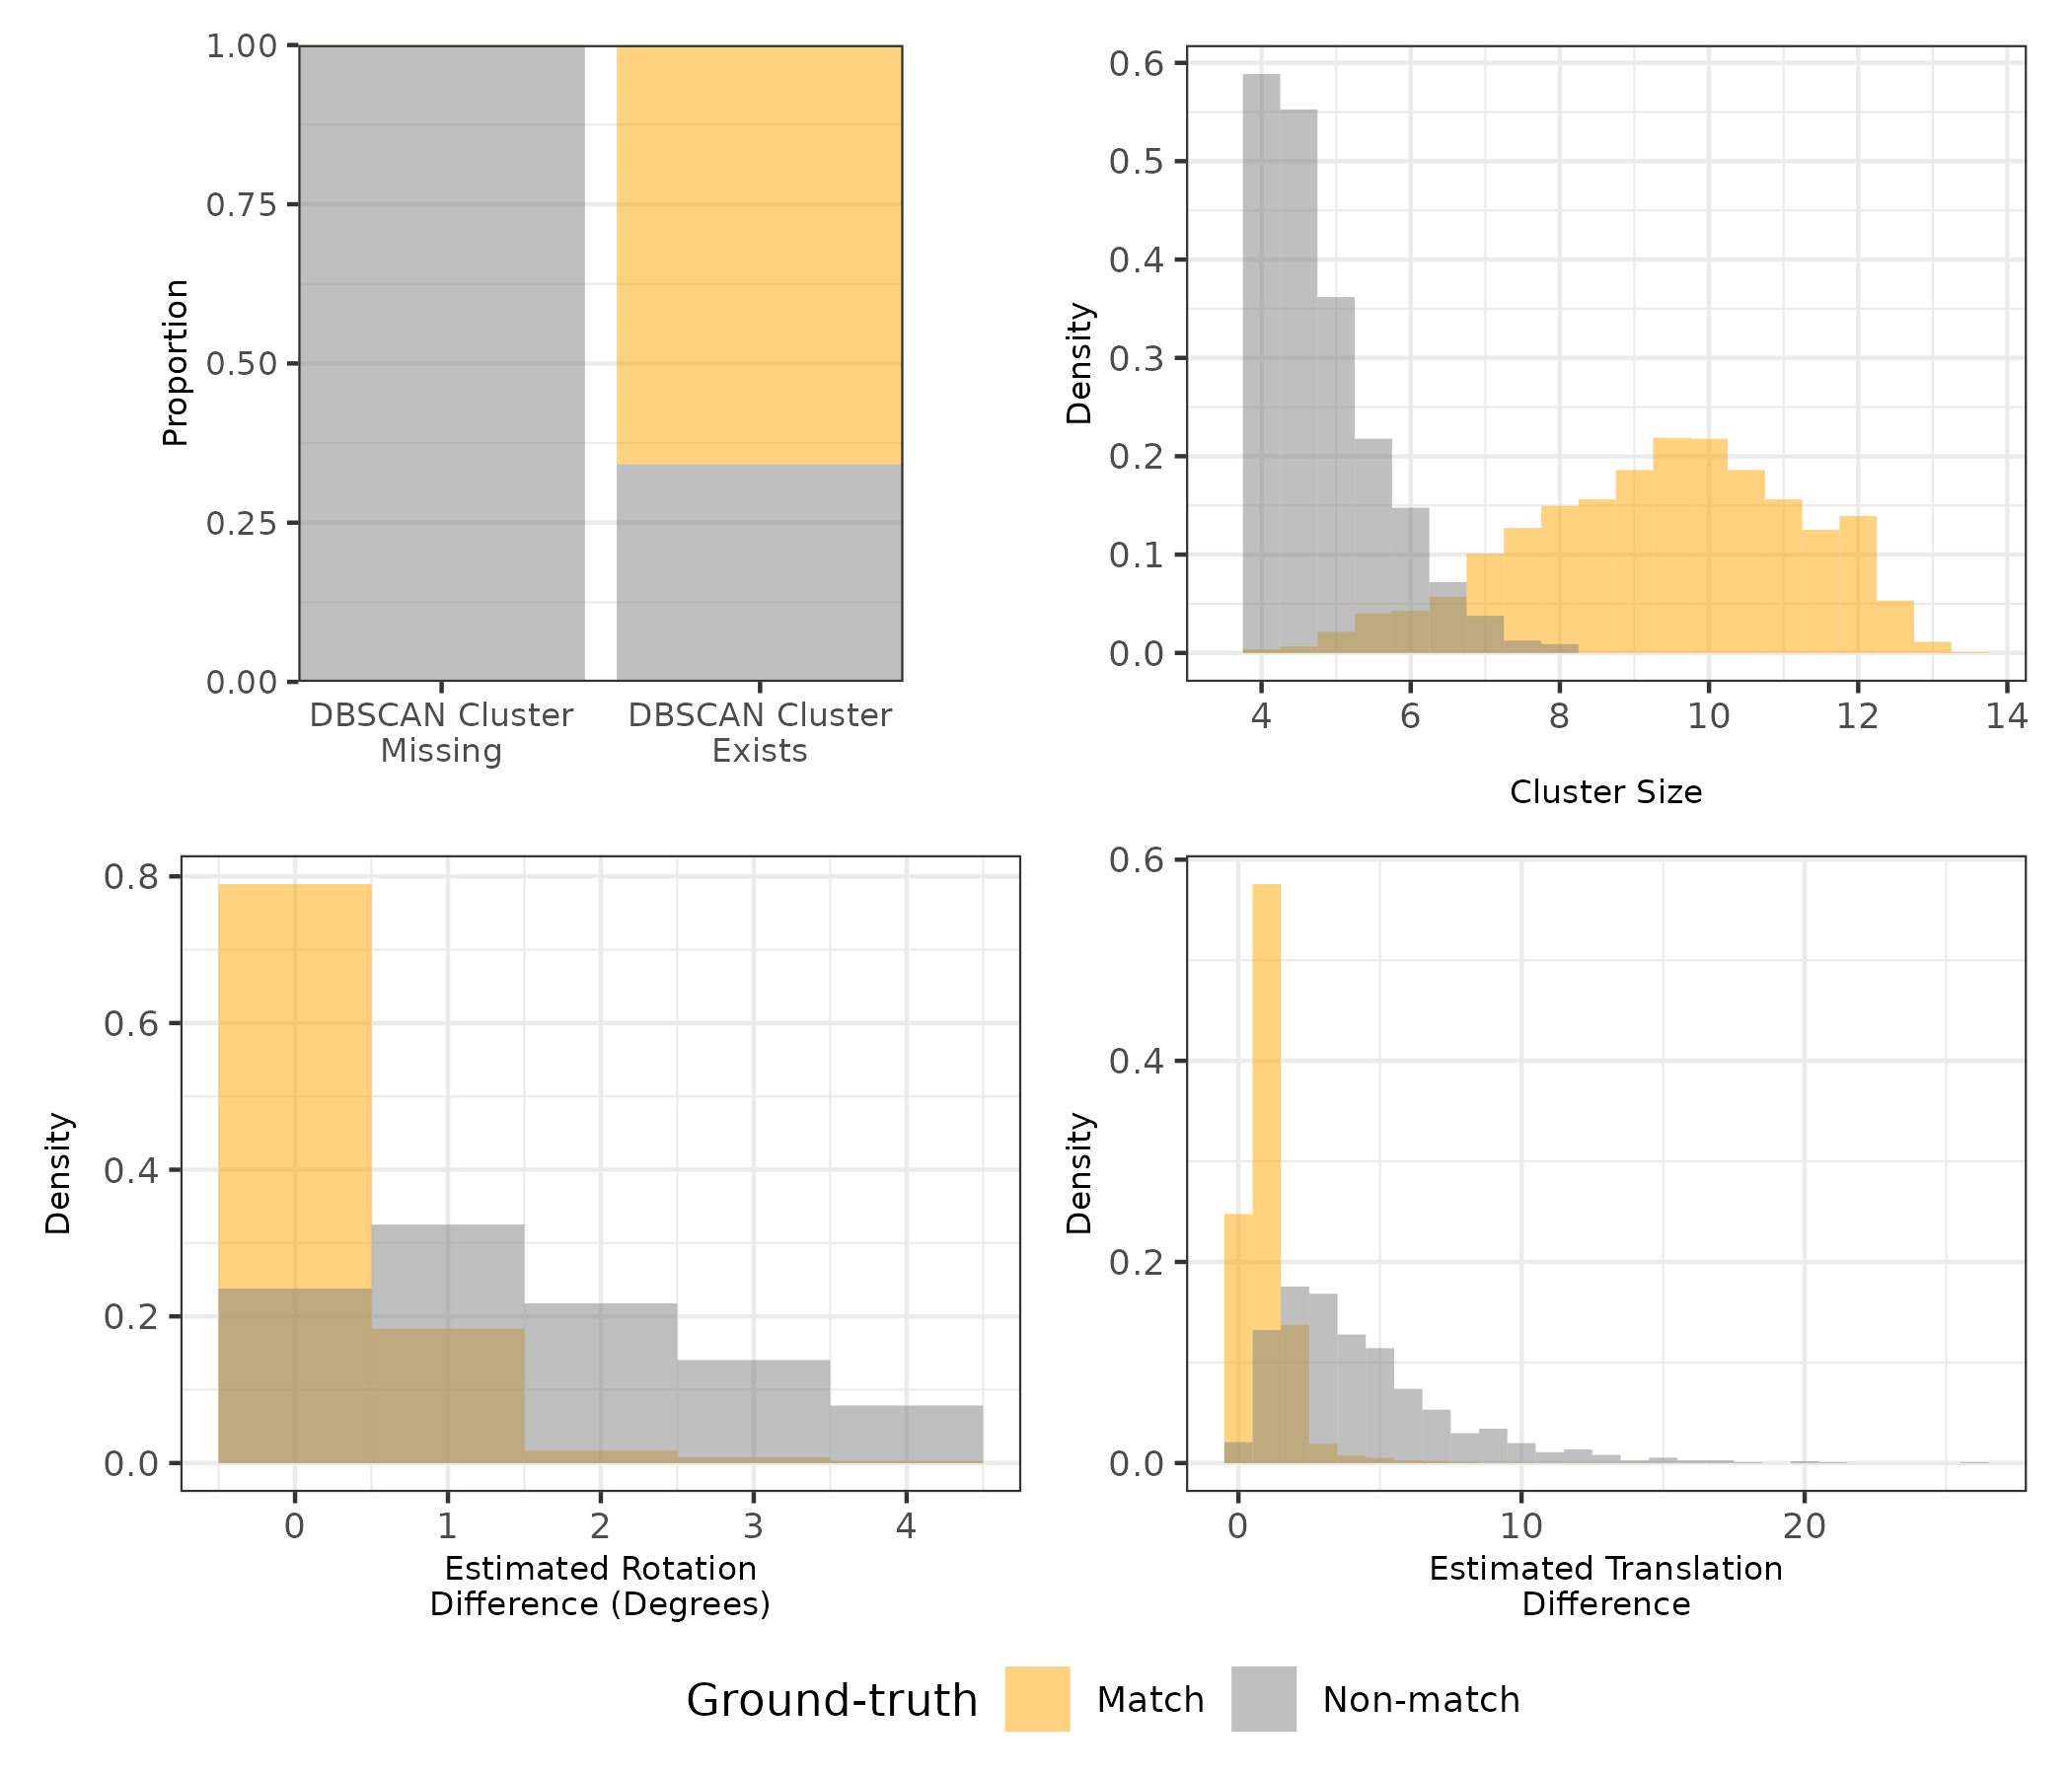
Density-based Features
For a matching cartridge case pair…
Cells should “agree” on a particular registration
The estimated registrations between the two comparison directions should be opposites
- Apply Density-Based Spatial Clustering of Applications with Noise (DBSCAN) algorithm to the cell-based registration results (Ester et al. 1996; Zhang et al. 2021)
Features:
DBSCAN cluster indicator
Average DBSCAN cluster size
Absolute sum of density-estimated rotations
Root sum of squares of the cluster-estimated translations
Similarity Score Distributions
We consider classification accuracy as a means of selecting/comparing models.
In practice, the examiner would use the similarity score as part of their examination.
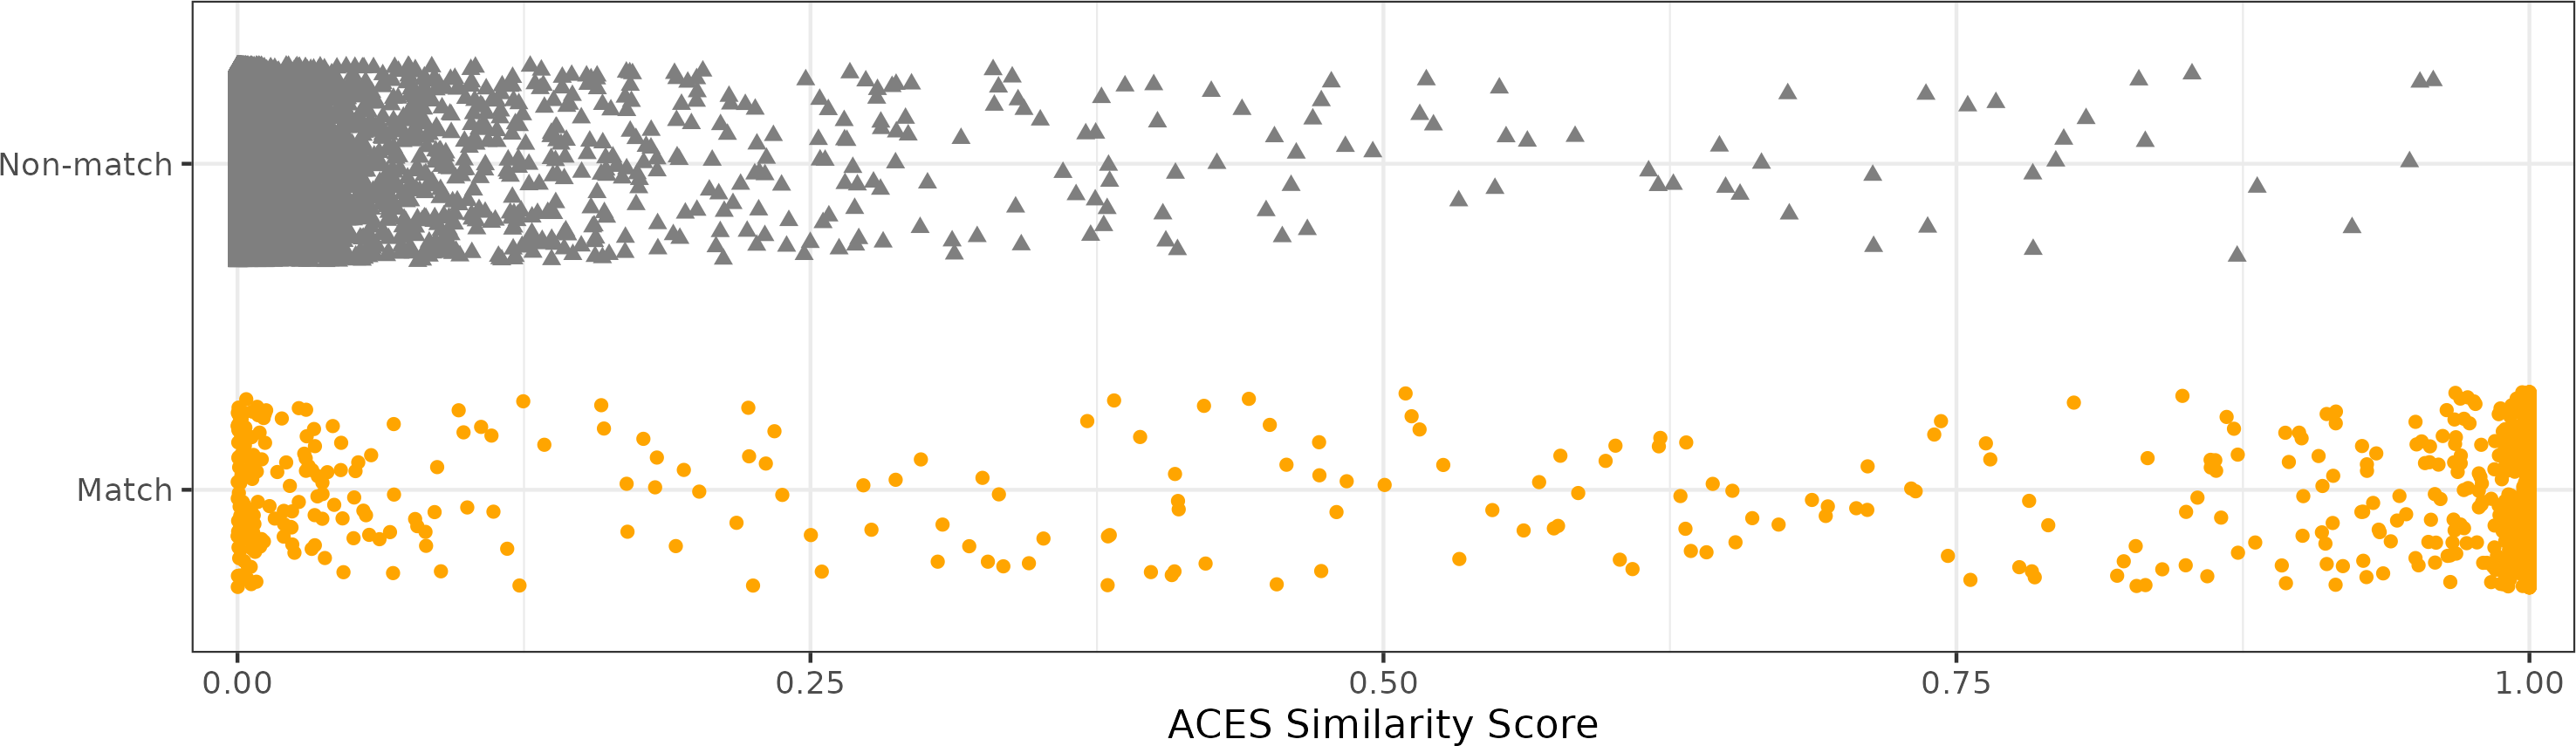
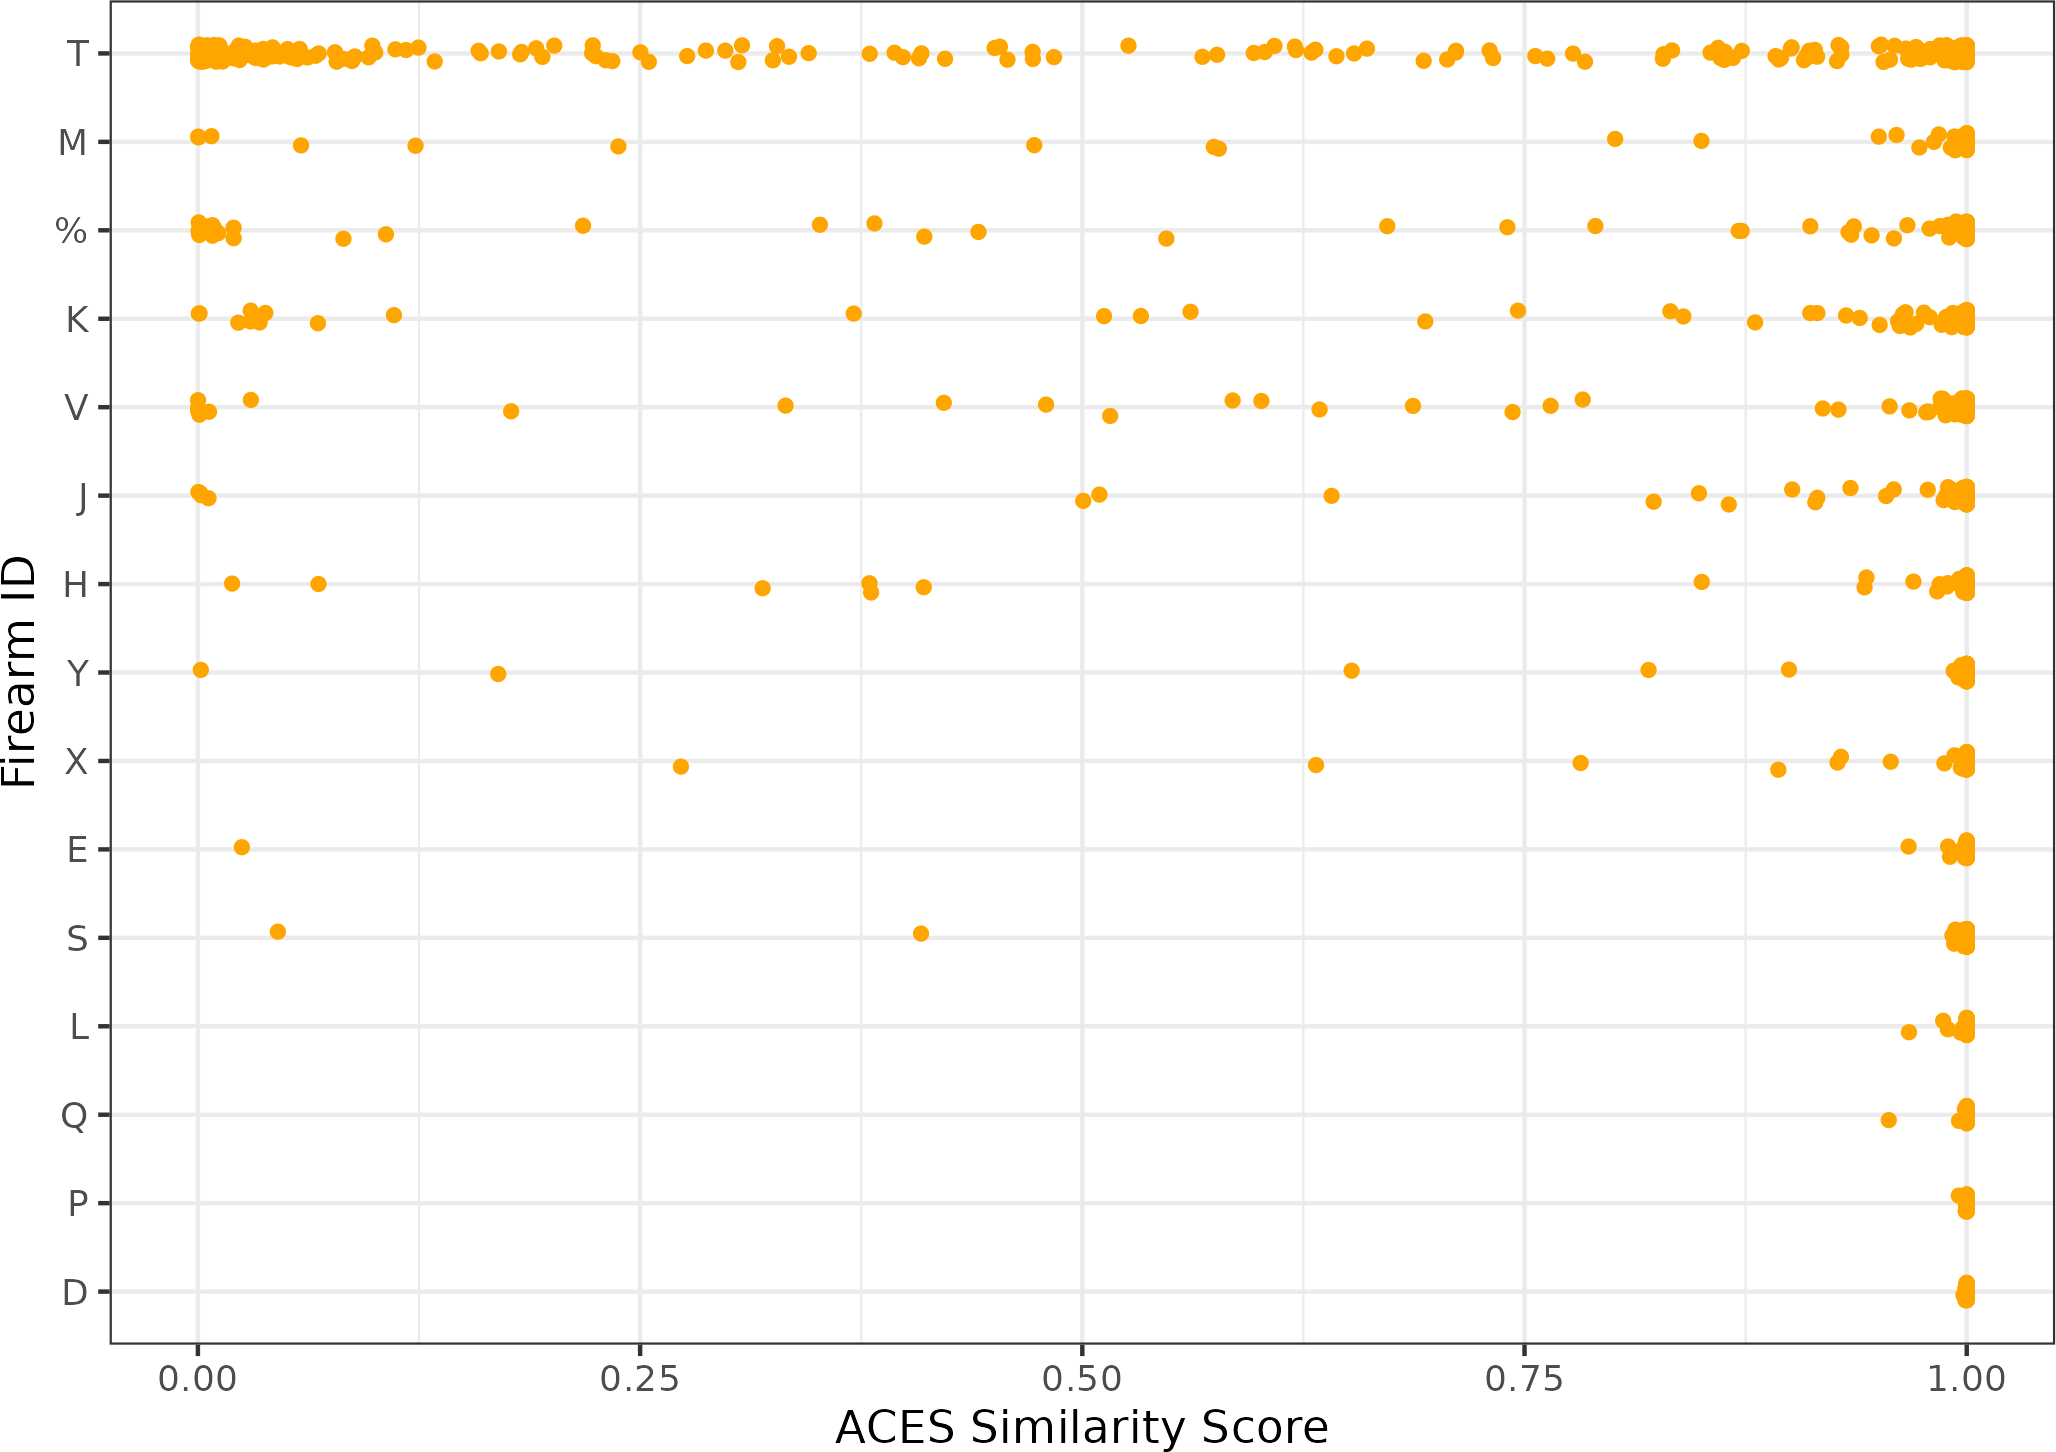
- Matching comparisons from Firearm T cartridge cases tend to have lower similarity scores:
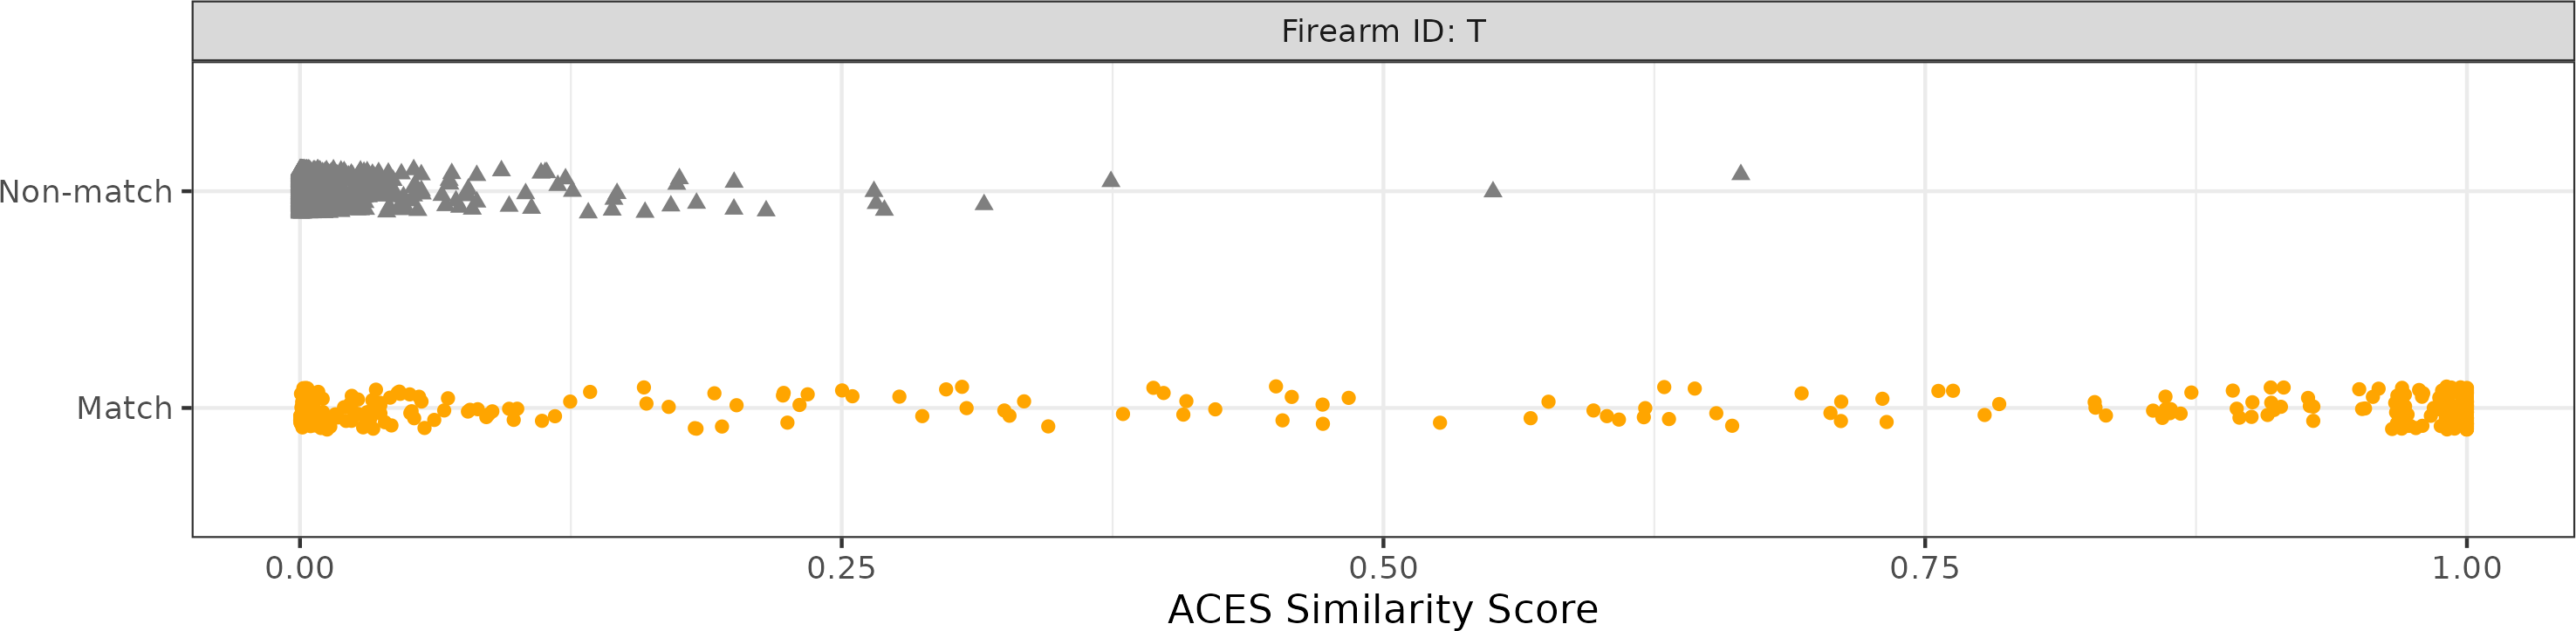
Appendix: Firearm-wise Similarity Scores
- Specific firearms in the test set tend to have lower associated similarity score for matching comparisons